Project Description
You may satisfy the requirements of this assignment by finding two data sets about your hometown: one concerning the population of through time, and the other concerning historical averages of high temperatures.Getting Your Hometown Data
There are plenty of websites you can consult for this data. The easiest option, of course, is to look up your hometown on Wikipedia and use the data they have there.If Wikipedia doesn't have what you're looking for, it's not the end of the world. The population data on Wikipedia usually comes from the U.S. Census Bureau, so if you cannot find the population data on Wikipedia, you may go to census.gov and find it there. The weather data can be obtained at a site like U.S. Climate Data or Weather Atlas.
The above being said, if you can find both data sets on Wikipedia, that will be perfectly fine. The main thing is to be sure to cite all of the sources you use. (I'll say a little more about this later.)
Fit Models to Your Population and Temperature Data
Once you have your data in hand, you will fit curves to your data. You may use either the course website to do this, Holt.Blue Statistical Software Suite, or some other software package if you prefer. You will need to choose the model you're interested in. For example, suppose I have a data set for the population of XXXXXX, XX, USA given below: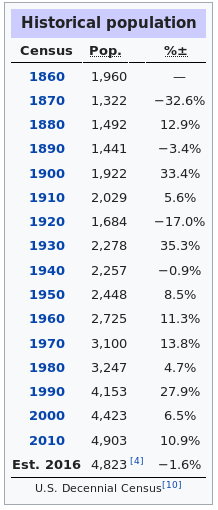
You will first need to plot your data. If you decide to use the course website, you may plot your data set by using the "Scatter Plot Maker" in the left-most column of the Holt.Blue Statistical Software Suite. You will enter the data in columns as seen below.

Note: For the above data, I used years since 1860 (the founding of XXXXXX) instead of the raw year. This will make your model simpler and, although it is not required, I advise that you do the same.
When you hit the "Make Scatter Plot" button, the following graph should pop up.

Part of your project will be to determine the type of model which best represents the data: linear, quadratic, exponential, sinusoidal, etc. With the above data set, the overall patter looks like exponential growth, so you might choose an exponential model. In this case you would enter the data into the "Exponential Regression Calculator" in a similar fashion as above. Note that all regression models are under the "Regression" column of the Holt.Blue Statistical Software Suite. After entering the data and hitting the "Calculate" button, the following output should appear.
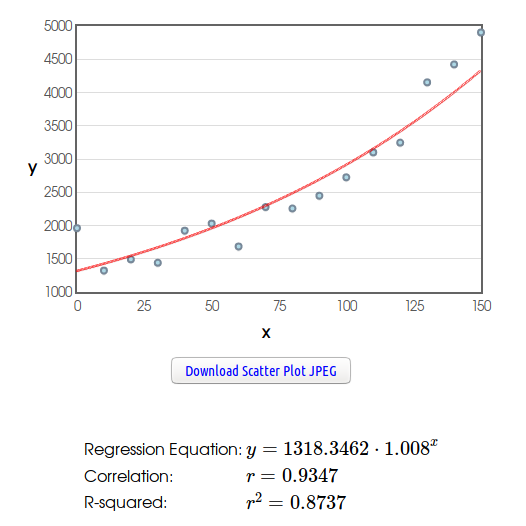
The exponential model of best for this data set is $P=1318.3462 \cdot (1.008)^t.$ You may ignore all the other statsy output: $r,$ $r\mbox{-squared},$ etc. Just use the equation of best fit as your model.
You will perform the above process on your temperature data as well.
Use Your Models to Make Predictions
You will be required to use you population and temperature models answer five very specific questions about your hometown. The following is an example of what you will do for one particular part of the assignment.One part of the assignment requires you to use your population model to predict the population and and its growth rate at the beginning of the year 2020.
Using the above data for XXXXXX, XX, USA as an example, we predict that the population in the year 2020, that is $t=160$ for our model, we predict that XXXXXX, XX will have $P(160)=1318.3462⋅(1.008)^{160}\approx 4717.53,$ or $4718$ residents.
Using this model we may also estimate the rate at which the population of XXXXXX, XX will be growing in 2020. To find the rate of change of population with respect to time, we find the derivative of $P$ with respect to $t$ of our exponential model: $$ \begin{array}{l} \displaystyle \frac{dP}{dt} \displaystyle =\frac{d}{dt}(1318.3462 \cdot (1.008)^t)\\\\ \displaystyle = 1318.3462 \cdot \frac{d}{dt}(1.008)^t\\\\ =1318.3462 \cdot \ln(1.008) \cdot (1.008)^t\\\\ =10.5048 \cdot (1.008)^t. \end{array} $$ Evaluating the derivative function $P'(t)=10.5048 \cdot (1.008)^t$ at $t=160,$ we obtain $P'(160) \approx 37.5901$ people per year.
We interpret the above to mean that in the year 2020, XXXXXX, XX will be growing at a rate of about $38$ people per year.
The Five Quantities You Will Estimate about Your Hometown
Using the population and temperature models you construct from your data, you will estimate the following five quantities:- The size of the population of XXXXXX, XX in 2020.
- The rate at which the population is growing (or shrinking) in 2020.
- The rate at which the average high temperature changes in May.
- The rate at which the average high temperature changes in October.
- The hottest time of the year as predicted by the temperature model.
The Required Sections of Your Paper
You will need to include several key sections in your paper. You may include more if you like to better address the individual characteristics of your hometown, but following sections are all required:Introduction
Describe the project to a reader who knows nothing about what you have set out to do.
Also, tell the reader about your hometown from your point of view. Copying and pasting the Wikipedia synopsis will be met with much disappointment and possibly a failing grade. Be genuine. Be yourself. Tell your reader about your hometown. It doesn't have to be drawn-out or super long. It just needs to be from your point of view. Of course, avoid informal language as you are still writing in an academic setting.
The Population Model
Tell your reader about your data set and where you found it. Construct your population model and answer points 1. and 2. above. Give your readers lots of detail along the way about how you constructed the model and the details of the calculations you made. Also, tell your reader why you chose the type of model that you did (linear, quadratic, exponential, sinusoidal, etc.). You may assume that your reader is familiar with the techniques of calculus, but be sure to write all conclusions in plain English too for any readers who are not.
The Average High-Temperature Model
Tell your reader about your data set and where you found it. Construct your temperature model and answer points 3., 4., and 5. above. Give your readers lots of detail along the way about how you constructed the model and the details of the calculations you made. Also, tell your reader why you chose the type of model that you did (linear, quadratic, exponential, sinusoidal, etc.). You may assume that your reader is familiar with the techniques of calculus, but be sure to write all conclusions in plain English too for any readers who are not.
Summary and Conclusions
Summarize the results of your efforts for your reader in plain English. This section should include a minimum jargon and mathematical symbols. (You've already proven your mathematical mettle in the previous sections.) Stick to the essentials of your findings so that a reader can get all of your findings in one convenient, tidy location.
Although it is not required, it's always nice say what you've gained or what you've learned by doing a substantial undertaking such as a project like this. Feel free to share any thoughts you have while maintaining a formal, academic tone.
References
List all references (textbooks, research papers, journals, websites) or anything else you used (e.g. statistical software) to write your paper. This is standard practice for any academic work in any discipline. Mathematics is no exception.
Works should be cited properly enough so that your reader will be able to find and use what you used in order to replicate your work.
An Example Paper
In order to get a sense of the level of writing expected for this project, I have included a sample A-level paper for the mystery town XXXXXX, XX, USA:A Population Model and Temperature Model for XXXXXX, XX.
This paper is meant to serve as an example of what a project could look like. It is not meant to be copied and pasted with your data filled in. Please don't put me in the position of having to tell you that plagiarism is bad and that you might fail the assignment. Be sure to write with your own voice!