Polar coordinates are alternative way to locate a point in the plane.
Rectangular Coordinate Review
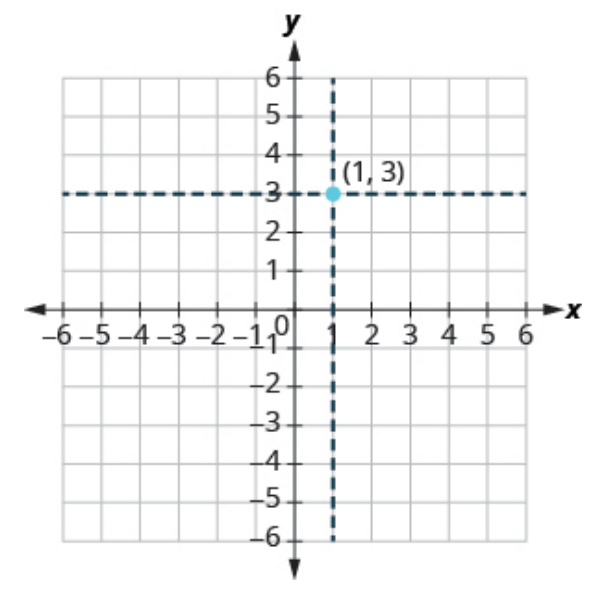
The familiar rectangular coordinates we all know and love tell us how to get to a location by telling us how far to go horizontally, and then how far to go vertically. For example, to get the the blue point, go $1$ to the right, and then $3$ up.
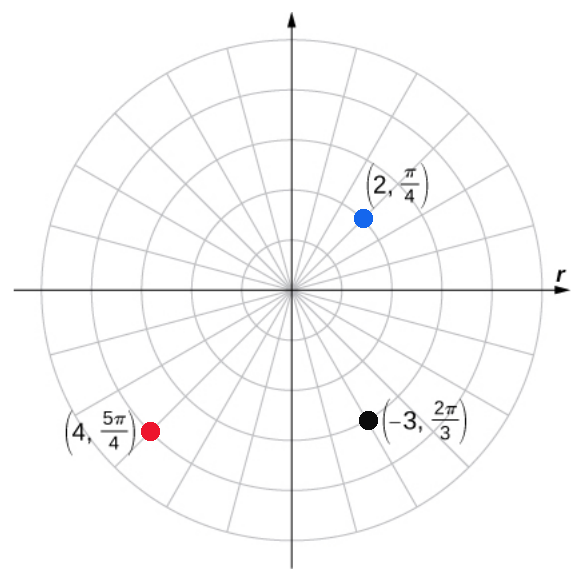
Polar Coordinates: Polar coordinates tell us how to get to a location by telling us what counterclockwise angle to turn, and then how far to go either forward or backward in that direction.
For example, to get the the blue point, turn $\frac{\pi}{4}$ radians, and then walk forward $2$ units.
To get to the red point, turn $\frac{5\pi}{4}$ radians, and walk forward $4$ units.
To get to the black point, turn $\frac{2\pi}{3}$ radians, and walk backward $3$ units.
Polar Coordinates
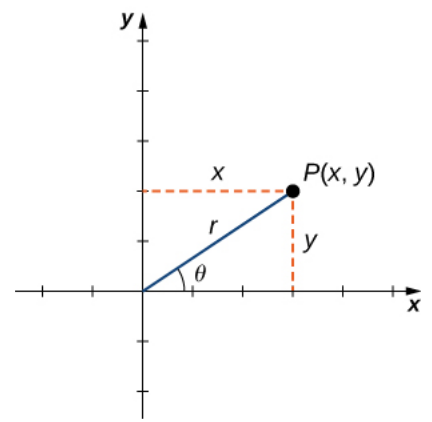
The point $P$ in the plane using rectangular coordinates $(x,y)$ is written in polar coordinates as the ordered pair $(r,\theta).$
Polar Coordinates
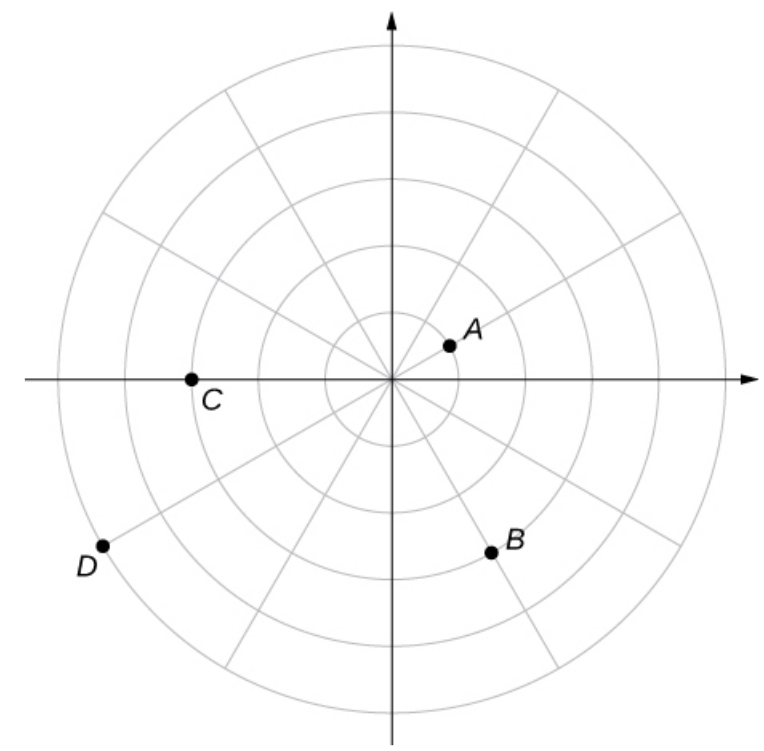
Example: Write the locations for points $A,$ $B,$ $C,$ and $D$ as ordered pairs using polar coordinates.
| Standard Representation | Alternative Representations | |
| Point $A:$ | $\displaystyle \left(1,\frac{\pi}{6}\right)$ | $\displaystyle \left(-1,\frac{7\pi}{6}\right)$ |
| Point $B:$ | $\displaystyle \left(3,\frac{5\pi}{3}\right)$ | $\displaystyle \left(-3,\frac{2\pi}{3}\right),$ $\displaystyle \left(3,-\frac{\pi}{3}\right)$ |
| Point $C:$ | $\displaystyle \left(3,\pi\right).$ | $(-3,0)$ |
| Point $D:$ | $\displaystyle \left(5,\frac{7\pi}{6}\right)$ | $\displaystyle \left(-5,\frac{\pi}{6}\right)$ |
Note: Every point has infinitely many alternative representations. However, every point can also be written uniquely if we stipulate that $r \gt 0$ and $0 \leq \theta \lt 2\pi.$
Polar Coordinates
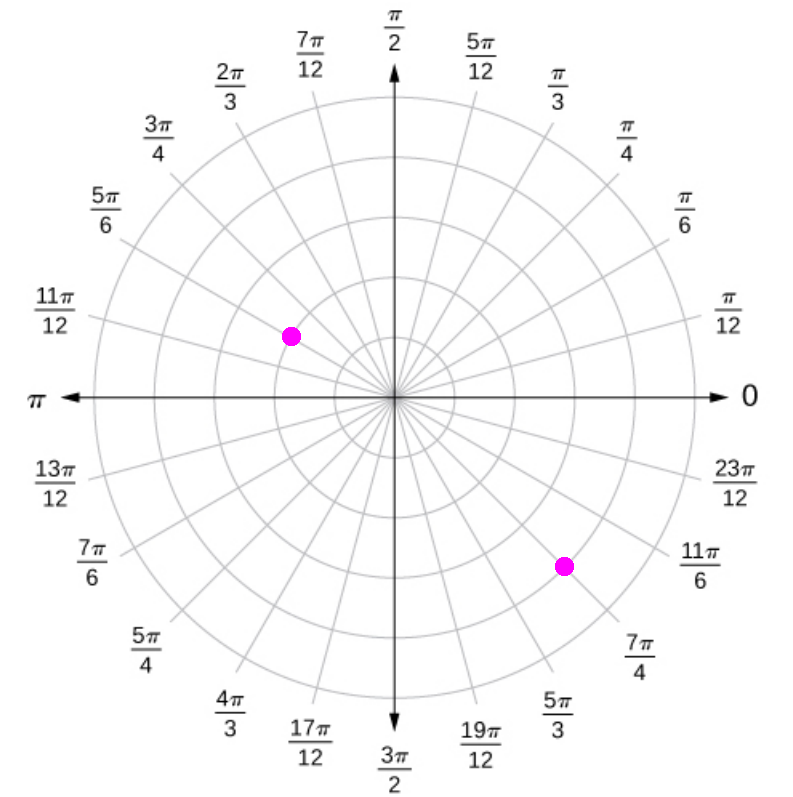
Example: Plot the points whose polar coordinates are given by first constructing the angle $\theta$ and then marking off the distance $r$ along the ray. $\displaystyle \left(2,\frac{5\pi}{6}\right),$ and $\displaystyle \left(-4,\frac{3\pi}{4}\right)$

Polar Coordinates and Rectangular Coordinates
As seen from the figure, the relationship between polar coordinates $(r,\theta)$ and rectangular coordinates $(x,y)$ is $$x=r\cos \theta \,\,\mbox{ and }\,\, y=r\sin \theta.$$

Polar Coordinates and Rectangular Coordinates
Example: Find rectangular coordinates for the given point in polar coordinates. $\displaystyle \left(2,\frac{5\pi}{4}\right)$
$$
\begin{array}{lll}
(x,y)&=(r\cos \theta, r\sin\theta)\\
&=\displaystyle\left(2\cos\left(\frac{5\pi}{4}\right),2\sin\left(\frac{5\pi}{4}\right)\right)\\
&=\displaystyle\left(2\left(-\frac{\sqrt{2}}{2}\right),2\left(-\frac{\sqrt{2}}{2}\right)\right)\\
&=\displaystyle\left(-\sqrt{2},-\sqrt{2}\right)\\
\end{array}
$$
Example: Consider the point $(-6,8)$ given in rectangular coordinates and convert to polar coordinates where $\theta \in [0,2\pi).$
We first visualize the point with a figure.
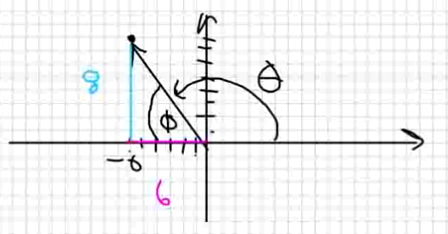
For this point $r=\sqrt{x^2+y^2}=\sqrt{(-6)^2+8^2}=\sqrt{36+64}=\sqrt{100}=10.$
Now, we can find $\theta$ by first finding the angle $\phi$ the ray makes with the $x$-axis. $$\phi= \tan^{-1}\left(\frac{y}{x}\right)=\tan^{-1}\left(\frac{8}{6}\right)\approx 0.927295218$$ Thus $$ \theta=\pi-\phi\approx 2.214297436 $$ Thus, the approximate polar representation of $(-6,8)$ is $(10,2.21).$
Polar Curves
Curves in the $xy$-plane result from plotting $(x,y)$ pairs which satisfy equations in $x$ and $y.$ For example, all the $(x,y)$ pairs which satisfy the equation $x^3+y^3=3xy$ are graphed below in green.
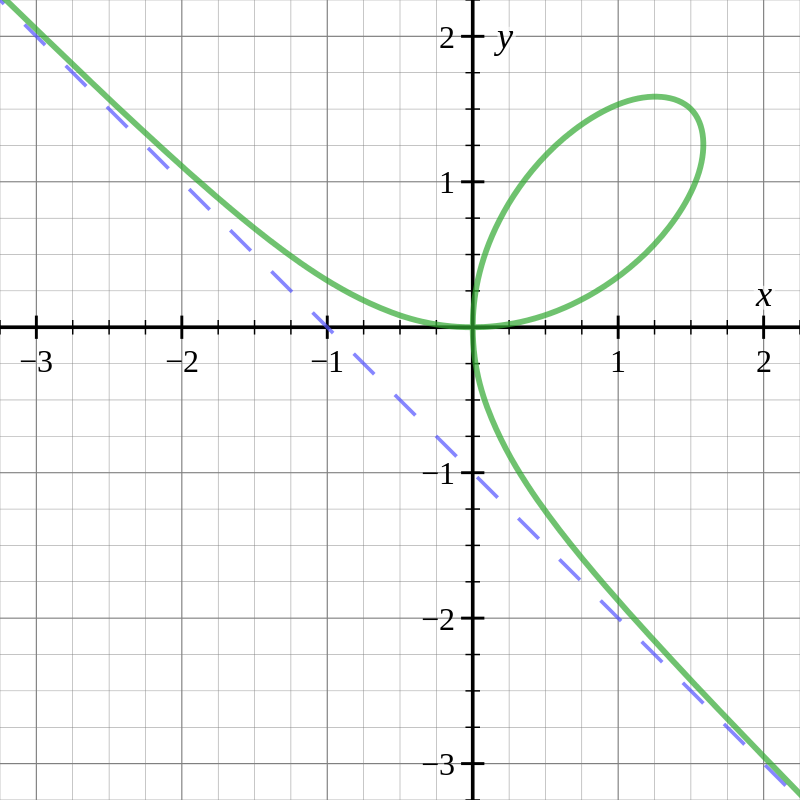
This curve is known as the Folium of Descartes.
Fun Question: What kind of curves would we get from equations involving $r$ and $\theta?$
Fun Answer: Polar Curves!
Polar Curves
Just as we let $y$ vary as a function of $x$ in rectangular coordinates, we shall let $r$ vary as a function of $\theta:$ $$r=f(\theta).$$ The result will be a polar curve.
Polar Curves
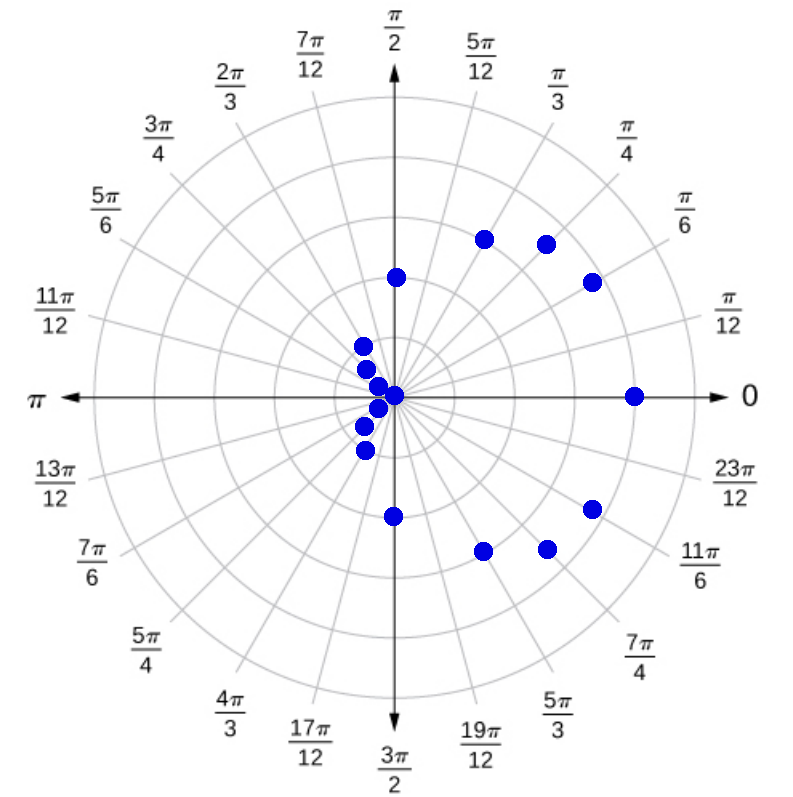
Similar to when we were learning how to graph in rectangular coordinates, we will make tables of values with $r$ and $\theta$ which satisfy $$r=f(\theta)$$ and then plot these points in polar coordinates.
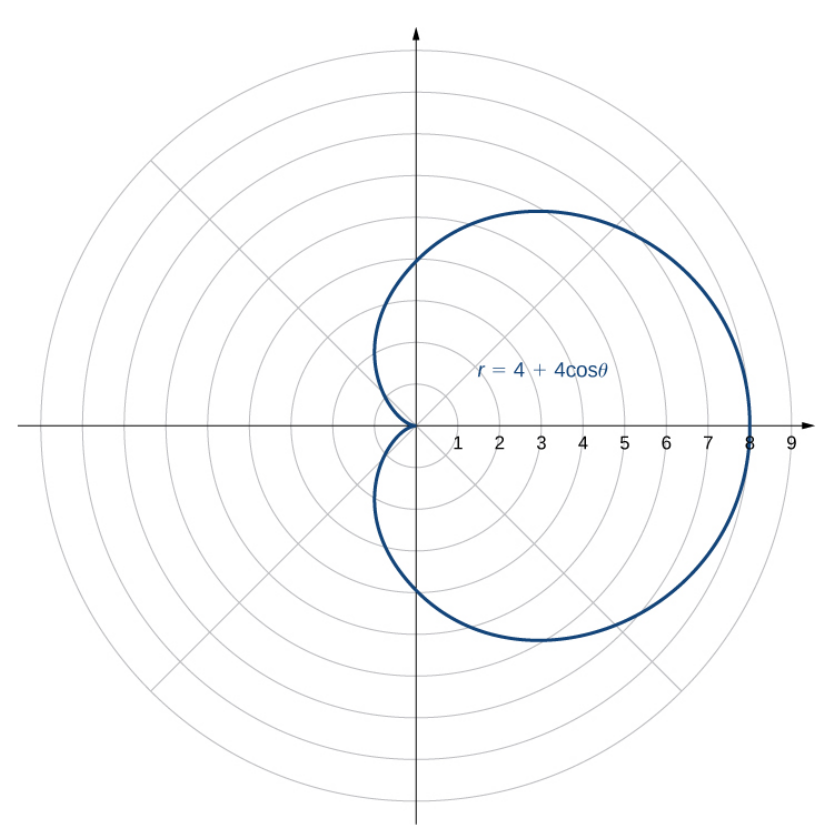
Polar-Curve Example: Plot the polar curve $r=f(\theta)=4+4\cos \theta$
| ${\scriptsize \begin{array}{|c|c|} \hline \theta & r \\ \hline 0 & 8 \\ \hline \frac{\pi}{6} & 4+2\sqrt{3} \approx 7.464101615 \\ \hline \frac{\pi}{4} & 4+2\sqrt{2}\approx 6.828427125\\ \hline \frac{\pi}{3} & 4+4 \cdot 0.5=6\\ \hline \frac{\pi}{2} & 4+4 \cdot 0=4\\ \hline \frac{2\pi}{3} & 4+4 \cdot (-0.5)=2 \\ \hline \frac{3\pi}{4} & 4-2\sqrt{2}\approx 1.171572875 \\ \hline \frac{5\pi}{6} & 4-2\sqrt{3}\approx 0.535898385 \\ \hline \pi & 0 \\ \hline \frac{7\pi}{6} & 4-2\sqrt{3}\approx 0.535898385 \\ \hline \frac{5\pi}{4} & 4-2\sqrt{2}\approx 1.171572875 \\ \hline \frac{4\pi}{3} & 4+4 \cdot (-0.5)=2 \\ \hline \frac{3\pi}{2} & 4+4 \cdot 0=4\\ \hline \frac{5\pi}{3} & 4+4 \cdot 0.5=6\\ \hline \frac{7\pi}{4} & 4+2\sqrt{2}\approx 6.828427125\\ \hline \frac{11\pi}{6} & 4+2\sqrt{3} \approx 7.464101615 \\ \hline \end{array}} $ |

|
Polar-Curve Example: Other Methods
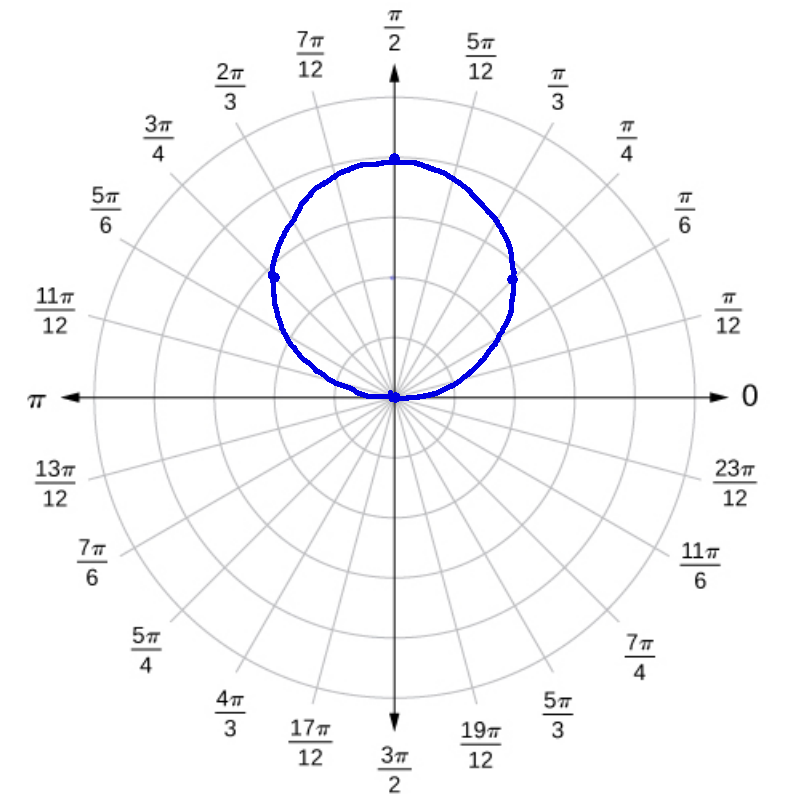
Convert the polar equation $r=4\sin \theta$ to rectangular form and sketch its graph.

Since $y=r\sin \theta,$ we multiply the polar equation, $r=4\sin \theta,$ by $r$ to get
$$
r^2=4r\sin \theta
$$
which gives
$$
r^2=4y
$$
Now, since $r^2=x^2+y^2,$
The above becomes
$$
x^2+y^2=4y
$$
This is the equation of circle not centered at the origin.
We now complete the square to determine the transformations which will allow us to graph the circle.
$$
\begin{array}{lll}
&\displaystyle x^2+y^2=4y &\mbox{}\\
\implies &\displaystyle x^2+y^2-4y=0&\mbox{}\\
\implies &\displaystyle x^2+y^2-4y+(-2)^2=0+(-2)^2&\mbox{completing the square}\\
\implies &\displaystyle x^2+(y-2)^2=4&\mbox{}\\
\end{array}
$$
Thus, the above is the equation of a circle of radius $2$ centered at $(0,2).$

Polar-Curve Example: Other Methods
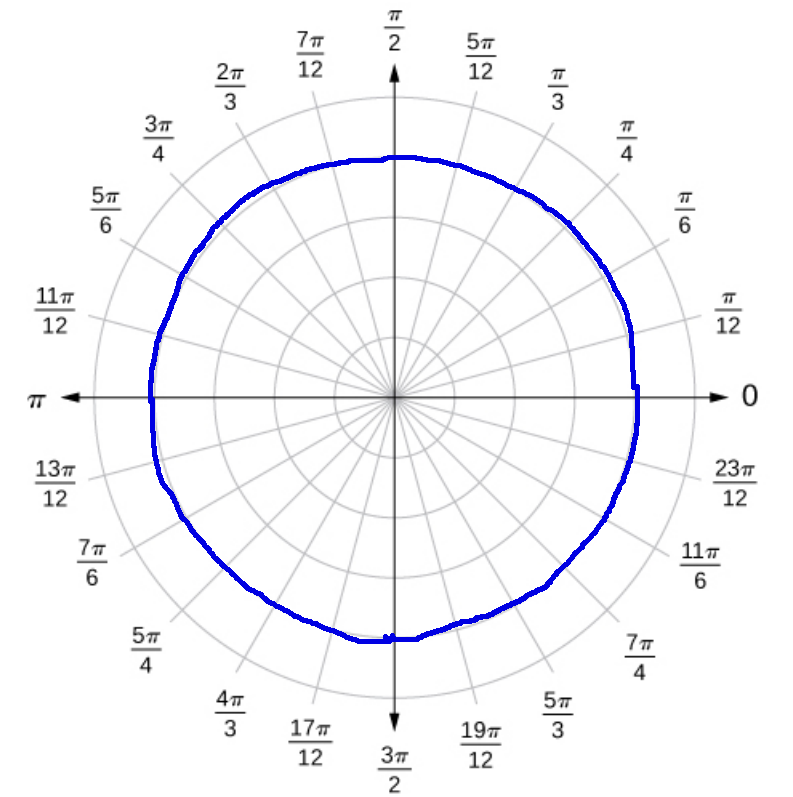
Convert the rectangular equation $x^2+y^2=16$ to polar form and sketch its graph.

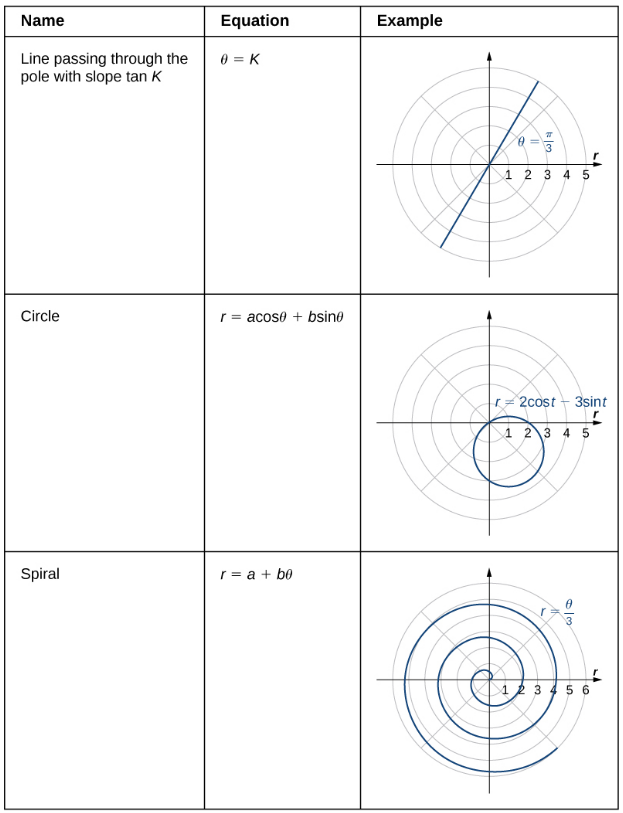
Polar-Curves: Other Forms
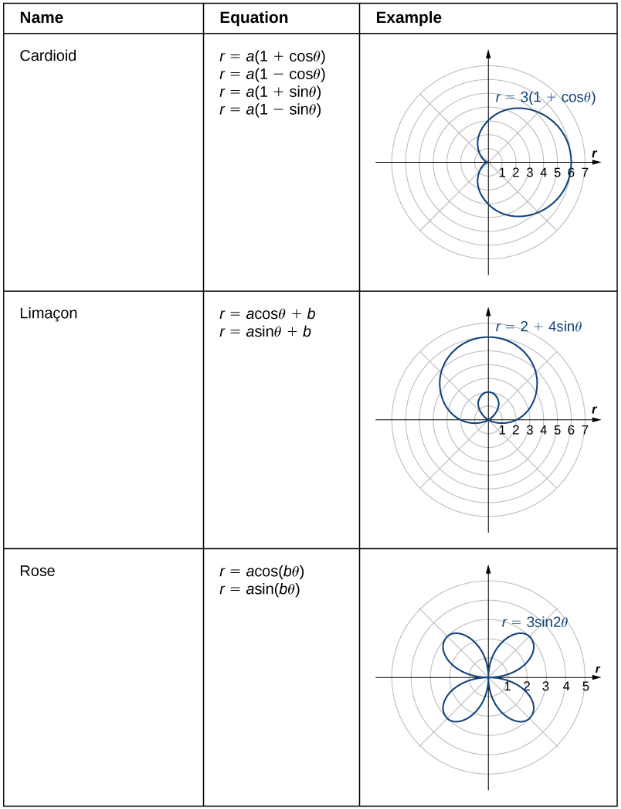
Symmetry in Polar-Curves
Recall that functions in rectangular coordinates can exhibit various forms of symmetry.
Moreover, symmetry can be very useful for simplifying computations. (For example, the definite integral of a function with odd symmetry over an interval centered at the origin is $0.$)
We now look at symmetry in the polar setting.
Symmetry About the Horizontal Axis
The curve $r=4+4\cos \theta$ exhibits symmetry about the horizontal axis.
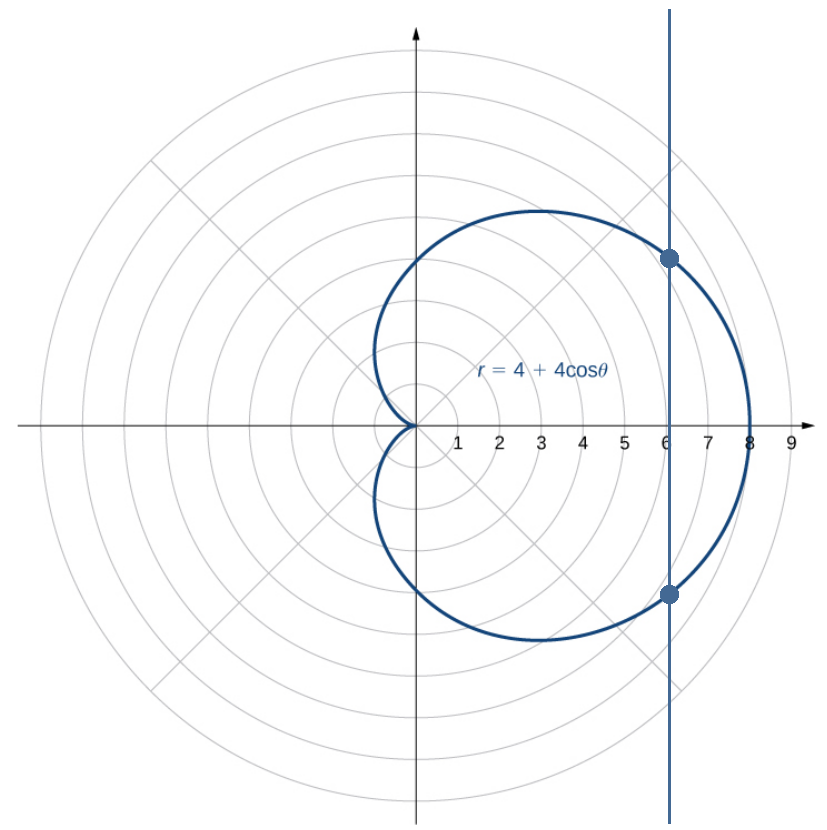
Formally, this means for every point $(r,\theta)$ on the graph of $r=f(\theta),$ the point $(r,-\theta)$ is also on the graph.
Symmetry About the Pole (or Origin)
The curve $r=3\sin 2\theta$ exhibits symmetry about the pole (or origin).
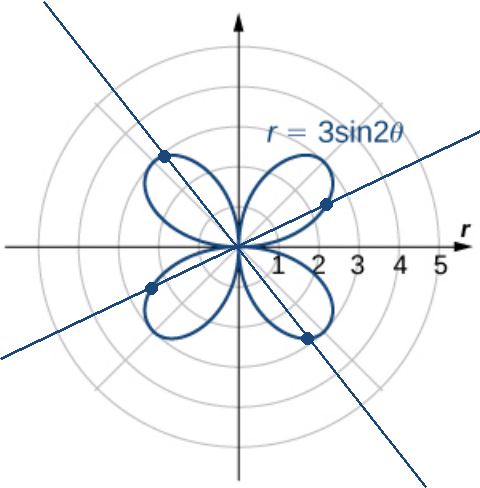
More formally, this means for every point $(r,\theta)$ on the graph of $r=f(\theta),$ the point $(-r,\theta)$ is also on the graph.
Equivalently, this means for every point $(r,\theta)$ on the graph of $r=f(\theta),$ the point $(r,\theta+\pi)$ is also on the graph.
Symmetry About the Vertical Axis
The curve $r=2+4\sin \theta$ exhibits symmetry about the vertical axis.
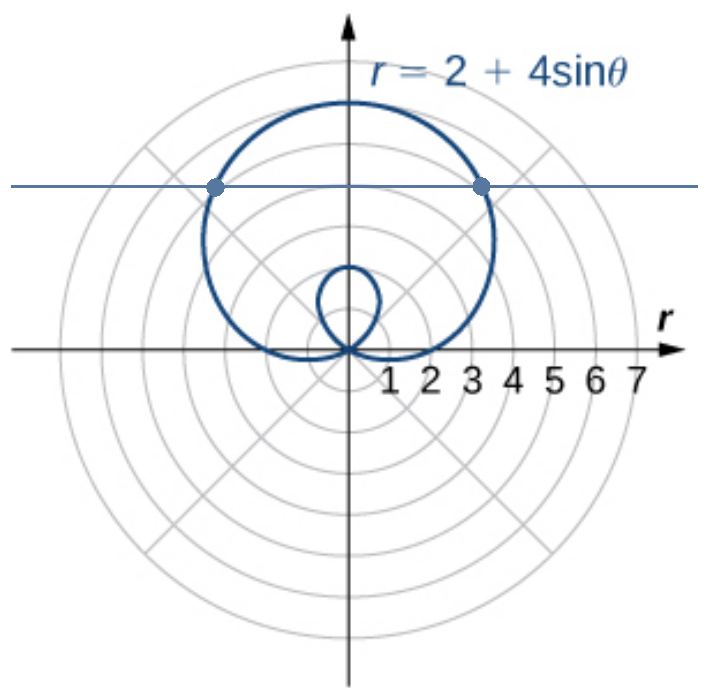
Formally, this means for every point $(r,\theta)$ on the graph of $r=f(\theta),$ the point $(r,-\theta+\pi)$ is also on the graph.
Example: Use symmetry to help sketch a graph of the polar equation $r=5-4\sin \theta.$
| ${\scriptsize \begin{array}{|c|c|} \hline \theta & r \\ \hline 0 & 5 \\ \hline \frac{\pi}{6} & 5-4 \cdot 0.5=3 \\ \hline \frac{\pi}{4} & 5-4\sqrt{2}\approx 2.1716\\ \hline \frac{\pi}{3} & 5-4\left(\frac{\sqrt{3}}{2}\right) \approx 1.5359\\ \hline \frac{\pi}{2} & 1\\ \hline \frac{2\pi}{3} & \mbox{Use Symmetry!} \\ \hline \frac{3\pi}{4} & \mbox{Use Symmetry!}\\ \hline \frac{5\pi}{6} & \mbox{Use Symmetry!} \\ \hline \pi & \mbox{Use Symmetry!}\\ \hline \frac{7\pi}{6} & \mbox{Use Symmetry!} \\ \hline \frac{5\pi}{4} & \mbox{Use Symmetry!} \\ \hline \frac{4\pi}{3} & \mbox{Use Symmetry!} \\ \hline \frac{3\pi}{2} & 9\\ \hline \frac{5\pi}{3} & 5+4\left(\frac{\sqrt{3}}{2}\right) \approx 8.4641\\ \hline \frac{7\pi}{4} & 4+2\sqrt{2}\approx 7.8284\\ \hline \frac{11\pi}{6} & 5+4 \cdot 0.5=7 \\ \hline \end{array}} $ |

|
Since $\sin \theta=\sin(-\theta+\pi),$ we have that $f(\theta)=f(-\theta+\pi).$
That is, the graph is symmetrical about the vertical axis.
So, we first plot the points in the right half of the plane.
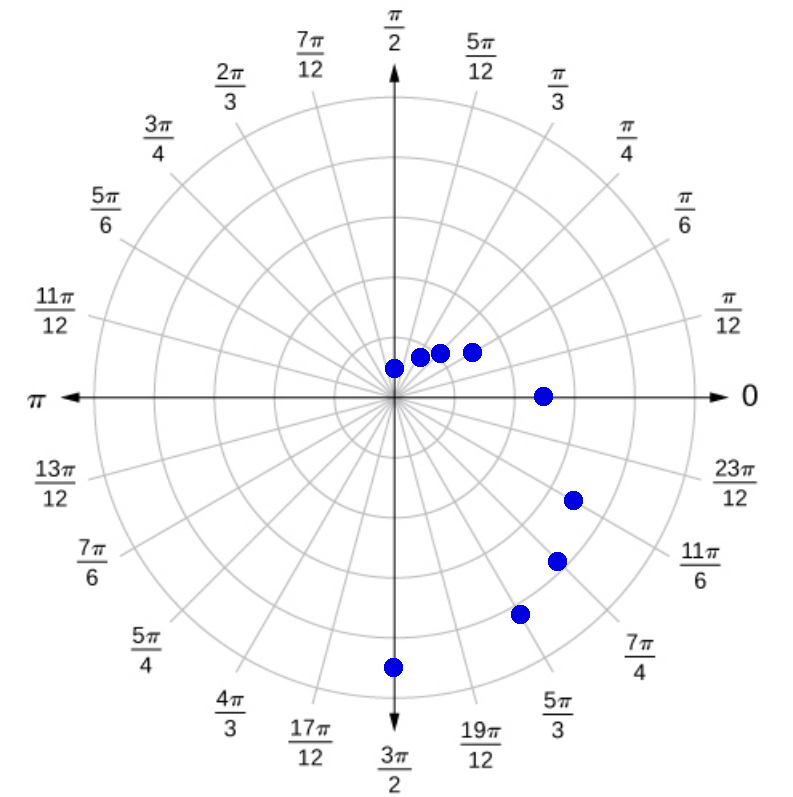
By symmetry, we plot the rest of the points.
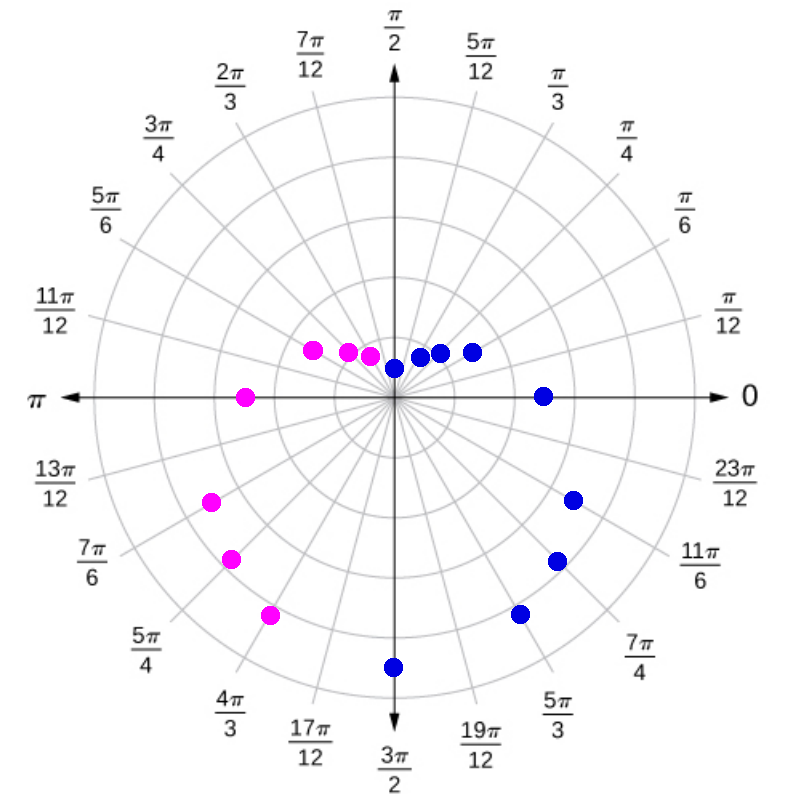
So, we first plot the points in the right half of the plane.

By symmetry, we plot the rest of the points.

Big Fact
Polar curves can always be represented parametrically!
Since $x=r\cos \theta$ and $y=r\sin \theta,$ the parametric representation of $r=f(\theta)$ is $$ \begin{array}{c} x(\theta)=f(\theta)\cos \theta\\ y(\theta)=f(\theta)\sin \theta\\ \end{array} $$
Example: The cardioid $r=1+\sin \theta$ has a parametric representation $$ \begin{array}{c} x(\theta)=(1+\sin \theta)\cos \theta\\ y(\theta)=(1+\sin \theta)\sin \theta\\ \end{array} $$
In What Situations Are Polar Coordinates Actually Useful?
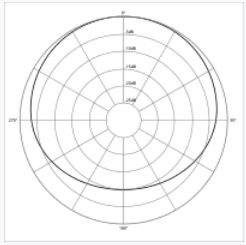
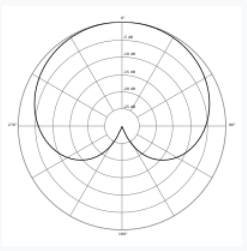
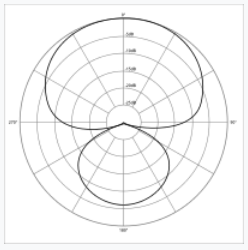
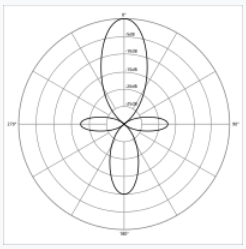
Application: Acoustics (Microphone Directionality)
Polar curves model the sensitivity of a microphone in different directions.
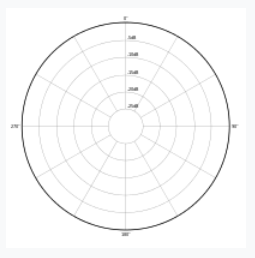 | 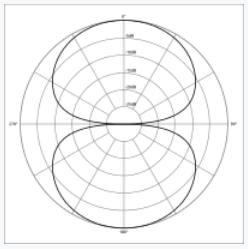 |  |
| Omnidirectional | Bi-directional | Subcardioid |
 |  |  |
| Cardioid | Hypercardioid | Shotgun |
In What Situations Are Polar Coordinates Actually Useful?
Application: Circular data sets.
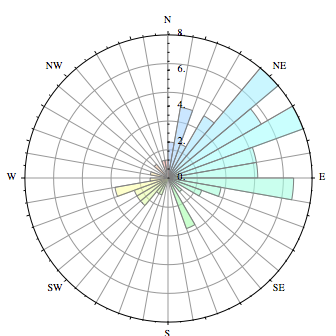
Some kinds of data are circular in nature, such as wind direction. The data below could be modelled by a polar curve.
Other Appearances
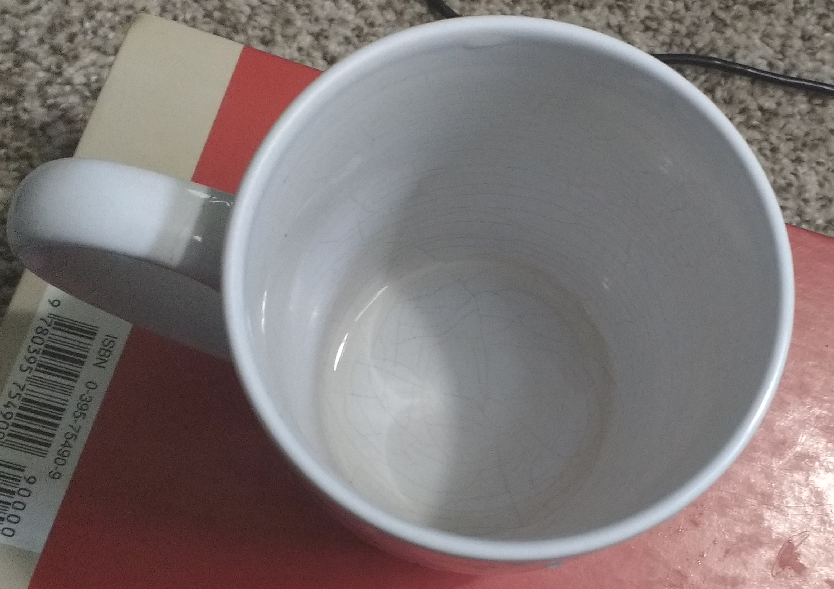
Cardioids and Coffee Cups.

In What Situations Are Polar Coordinates Actually Useful?
Transforming a problem to polar coordinates, especially when there is some kind of radial symmetry involved, can greatly reduce the amount of work required to solve it.
If you go on to take multivariable calculus, or a course in partial differential equations, the above statement will become more meaningful.