Question: Do Florida boat registrations kill manatees?

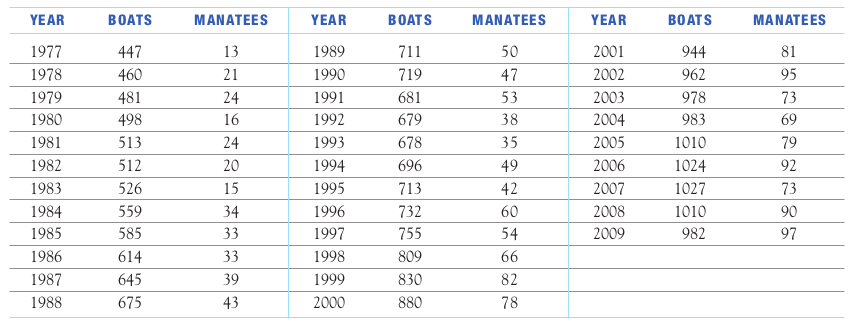
Example: The table below lists the number of Florida boat registrations and manatee deaths from 1977 to 2009.
Example: Below is a scatterplot of manatee deaths versus the number of boat registrations in Florida. Each point represents a particular year.
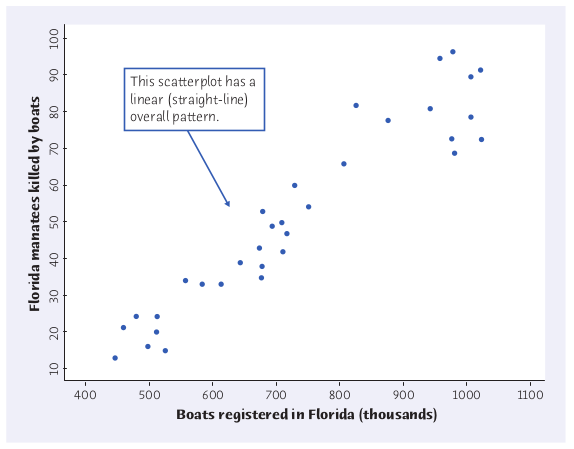
In general, when graphing a relationship between two variables, the variable on the horizontal (or $x$) axis is called the explanatory variable, and the variable on the vertical (or $y$) axis is called the response variable.
Looking at the scatterplot, do you think manatee deaths in a given year are explained by the number of boat registrations?
Which is the explanatory variable? Which is the response variable?
When we compare relationships between two variables, (i.e., make a scatterplot), we should look for an overall pattern stating the
- direction
- form
- strength of the relationship
- outliers or other deviations from the overall pattern.
What do we see when we examine the manatee graph? What is the strength of the relationship?
Correlation is a way of measuring the strength and direction of a linear relationship.
Correlation is very often denoted by $r$.
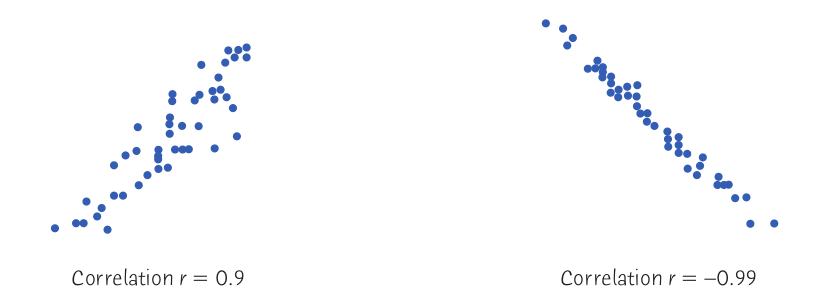
If the correlation $r$ is positive, the association is positive.
If the correlation $r$ is negative, the association is negative.
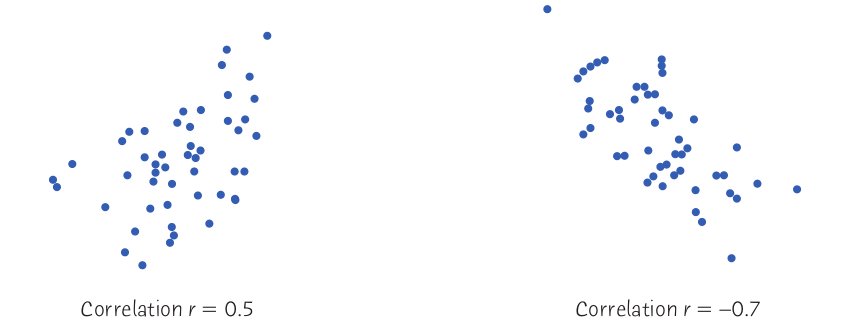
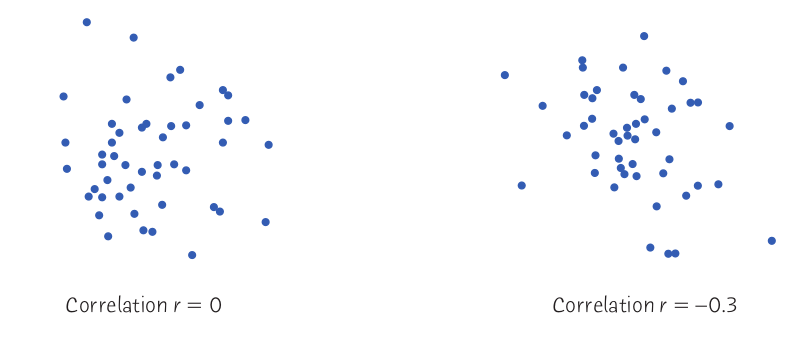
The closer the correlation $r$ is to zero, the weaker the relationship.
How do we calculate correlation? $$r=\frac{1}{n-1}\left[ \left(\frac{x_1-\overline{x}}{s_x}\right) \left(\frac{y_1-\overline{y}}{s_y}\right)+\left(\frac{x_2-\overline{x}}{s_x}\right) \left(\frac{y_2-\overline{y}}{s_y}\right) +\cdots+\left(\frac{x_n-\overline{x}}{s_x}\right) \left(\frac{y_n-\overline{y}}{s_y}\right) \right]$$ The more compact notation uses sigma notation: $$r=\frac{1}{n-1}\sum_{j=1}^{n}\left(\frac{x_j-\overline{x}}{s_x}\right) \left(\frac{y_j-\overline{y}}{s_y}\right)$$
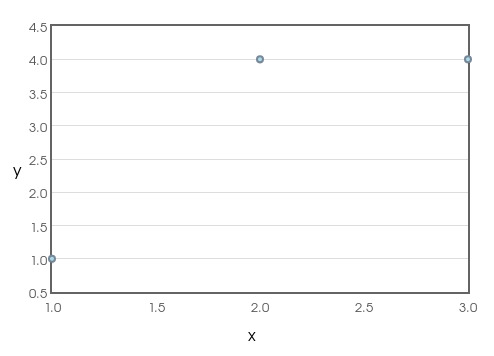
Example: Suppose we collect the data set: $(1,1)$,$(2,4)$, and $(3,4)$. What is the correlation?
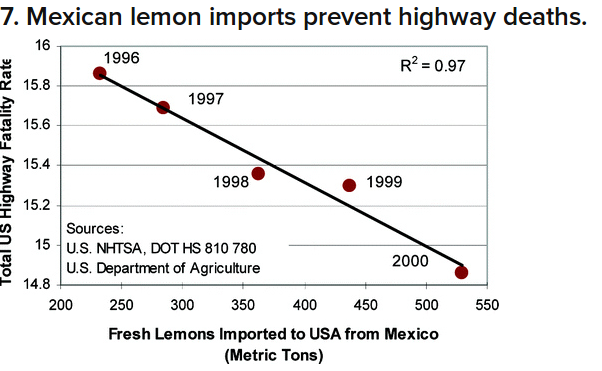
Savvy Citizen Fact #3: Correlation DOES NOT Imply Causation.
Example: Consider the relationship between lemon imports from Mexico and traffic deaths in the United States.