Density Curves: You know you're earning baccalaureate credit when you start throwing around terminology like "density curves."
Density Curve Basics:
- The area under ANY density curve is 1. This essentially means 100%.
- The fraction of observations between two values is the area under the curve.
A VERY Special Density Curve: The Normal Distributions.
A normal distribution is often colloquially referred to as a "bell curve."
Normal distributions model certain kinds of data very well.
Examples of Normal Distributions: Heights, Weights, Manufactured Items (sizes, weights), IQ test scores, precipitation records.
There are many examples found in biology and other natural systems.
In other words, normal distributions are EVERYWHERE!
Example: Iowa Test Scores.
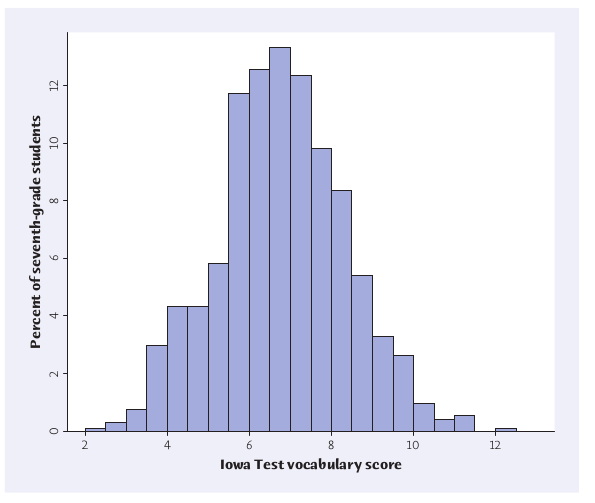
Example: Iowa Test Scores.
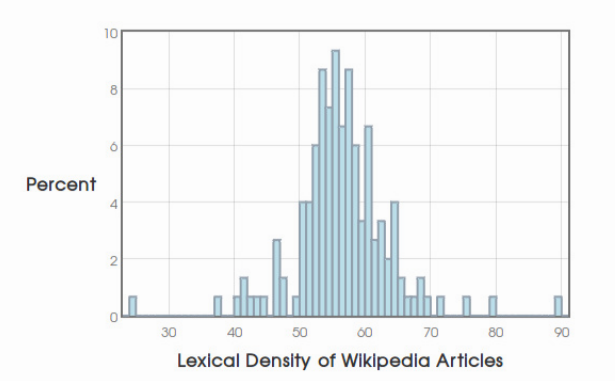
Research Question: is lexical density normally distributed?
Normal Distribution Basics
Every normal distribution is determined by two numbers: the mean $\mu$, and the standard deviation $\sigma$.
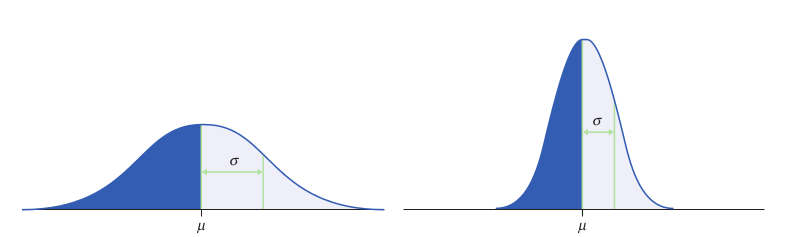
$\mu$ tells us where the center of our distribution is.
$\sigma$ tells us how wide, or "spread out," the distribution is.
A normal distribution with mean $\mu$ and standard deviation $\sigma$ is denoted as $N(\mu,\sigma)$.
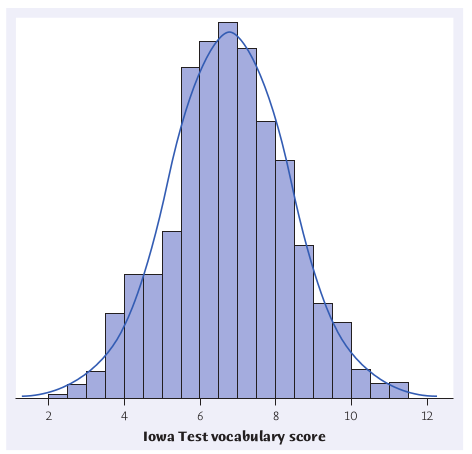
Example: Iowa Test Scores, AGAIN.
Example: Iowa Test Scores, AGAIN.
The normal distribution $N(6.84,1.55)$ models this data set very well.
Normal Distribution Basics: the 68-95-99.7 Rule
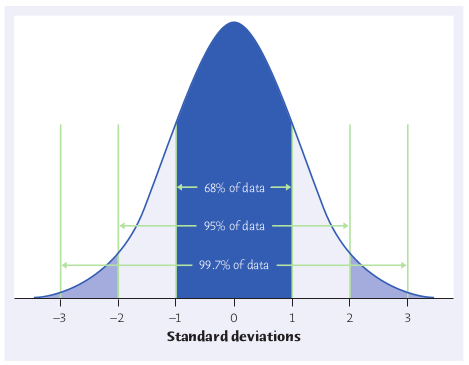
About 68% of observations lie within 1 standard deviation of the mean.
About 95% of observations lie within 2 standard deviations of the mean.
About 99.7% of observations lie within 3 standard deviations of the mean.
Example: Iowa Test Scores, AGAIN.
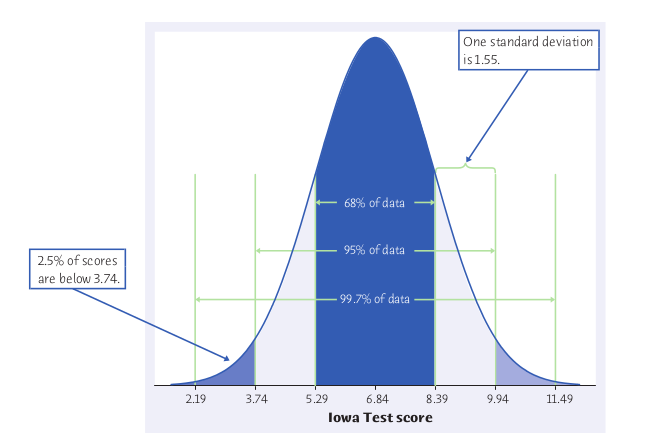
Example: Iowa Test Scores, AGAIN.
To answer this question, we need to find the area under the curve corresponding to 9 or less.
Example: Iowa Test Scores, AGAIN.
The normal distribution $N(6.84,1.55)$ describes the Iowa test score data set very well.
What percentage of students scored 9 or less?
To find the area under a standard normal curve $N(\mu, \sigma)$ for values BELOW an observation $x$:
- Compute the value $z=\frac{x-\mu}{\sigma}$.
- Use Table A in the course text, or use this table.
Example: Find the proportion of students who scored ABOVE $x=9$ on the Iowa Vocabulary Test.
Example: Find the proportion of students who scored above $x=4$, but below $x=9$, on the Iowa Vocabulary Test.
Example: Find the score on the Iowa Vocabulary Test which represents the 90th percentile.