Polls: When we want to get a sense of how a population feels about an issue, or what candidate they will vote for, we take a poll.
Essentially we want to estimate the percentage, or proportion, of people who will answer in a particular way.
More Generally: when we want to estimate the proportion of observations which fall into a certain category, we use inference for a population proportion.
Other Examples: Estimate the percentage (i.e., proportion) of...
- people who will vote for candidate A
- items in a shipment which are defective
- green M&Ms in a typical pack
- people who smoke
- dead trees in Tuolumne County
- things which fall into some category
Estimating Proportions
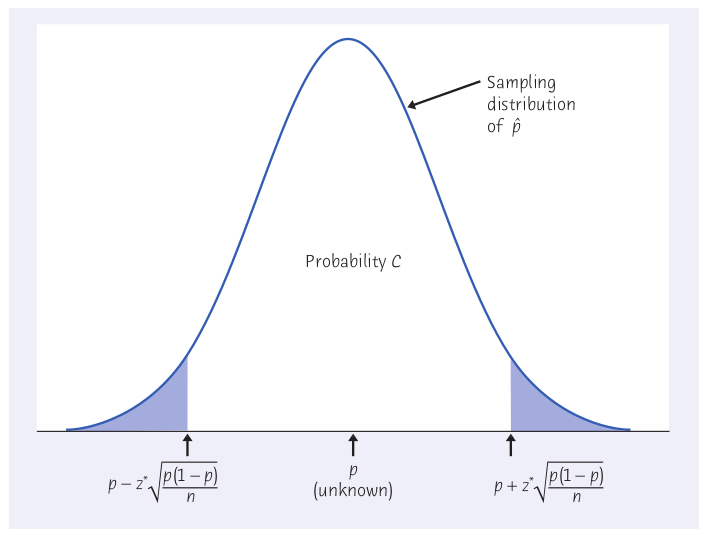
Draw an SRS of size $n$ from a large population that contains proportion $p$ of successes. Let $\hat{p}$ be the sample proportion of successes, $$\hat{p}=\frac{\mbox{number of successes}}{\mbox{sample size}}$$ Question: what is the sampling distribution of $\hat{p}$?
Answer
As the sample size increases, the sampling distribution of $\hat{p}$ becomes approximately Normal.
In particular, for large $n$, the sampling distribution of $\hat{p}$ gets closer to $$N\left(p,\sqrt{\frac{p(1-p)}{n}}\right)$$
How to Estimate $p$
Awesome!
So we can just calculate the interval $\hat{p} \pm z^* \sqrt{\frac{p(1-p)}{n}}$...
...right?
An Approximate Confidence Interval
Draw an SRS of size $n$ from a large population that contains an unknown proportion $p$ of successes. An approximate level $C$ confidence interval for $p$ is $$\hat{p} \pm z^* \sqrt{\frac{\hat{p}(1-\hat{p})}{n}}$$ Use this interval only when the numbers of successes and failures in the sample are both at least 15.
Example: 40% of the dots below are red, and 60% are blue. Let's pretend we don't know this and collect a random sample of dots to estimate the proportion of red dots.
Example: From a telephone survey of 229 Americans, Summer 1994, when asked the question:
"Do you wish Dennis Hopper would go back on drugs?"

15% of the sample answered "yes."
Calculate an approximate 95% confidence interval for the true proportion of Americans who would have answered "yes" to this question.
Problems
One big problem with these techniques is that they give accurate results only when the sample size is large.
Another problem is with small sample sizes, the counts of successes and failures may be too small, rendering the use of these techniques untrustworthy.
Question: Is there any way to fix this?
The "Plus Four" Confidence Interval.
Suppose you take a sample of size $n$ with $m$ successes. Instead of computing $\hat{p}=\frac{m}{n}$, compute the "plus four" estimate $$\tilde{p}=\frac{m+2}{n+4}.$$ Then the confidence interval $$\tilde{p} \pm z^* \sqrt{\frac{\tilde{p}(1-\tilde{p})}{n+4}}$$ is usually more accurate.
Use this interval when the confidence level is at least 90% and the sample size $n$ is at least 10, with any counts of successes and failures.
Example: Spain has a high rate of cocaine use, so it’s not surprising that euro paper currency in Spain often contains traces of cocaine. Researchers collected 20 euro bills in each of several Spanish cities and 17 out of 20 contained traces of cocaine. Estimate the proportion of all euro bills in Madrid that have traces of cocaine.

Planning a Study: Choosing your sample size.
The margin of error of our large sample confidence interval is $$m=z^*\sqrt{\frac{p(1-p)}{n}}$$
Performing some algebraic shenanigans we get the following nice result...
Planning a Study: Choosing your sample size.
The level $C$ confidence interval for a population proportion $p$ will have margin of error approximately equal to a specified value $m$ when the sample size is $$n=\left(\frac{z^*}{m}\right)^2p^*(1-p^*)$$ where $p^*$ is a guessed value for the sample proportion. The margin of error will always be less than or equal to $m$ if you take the guess $p^*$ to be 0.5.
Example
The inhabitants of Martiniville, U.S.A. are casting their vote for mayor. On the ballot this election are:
- Sleazy P. Martini (incumbent)
- Stubbs the Cat
Moreover, they all have telephones, they don't lie, and they love to chat on the phone with polsters.
The Situation: We want to estimate the true proportion of Martiniville residents who intend to vote for Stubbs the Cat as mayor within a margin of error of 3% with 95% confidence. How many people do we need to call?
Another way to ask this is: in repeated samples, how many people would we need to call if we want to get within 3% of the true proportion 95% of the time?
Let's call a sample of residents in Martiniville to estimate the proportion of people who intend to vote for Stubbs the Cat.
Estimate $\hat{p}$:
Confidence Interval:
Plus Four Confidence Interval:
Calling the Election: Who do you think is going to win?
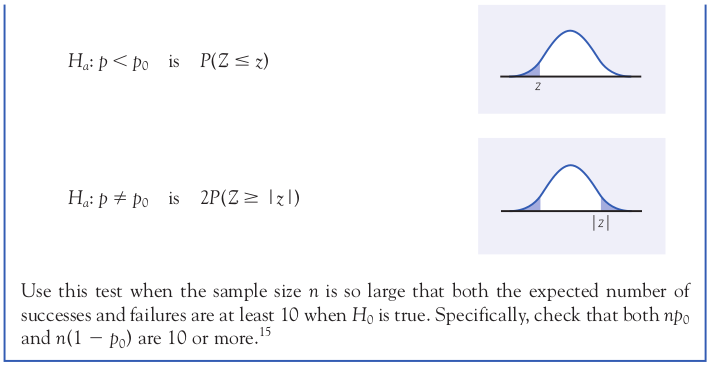
Tests of Significance
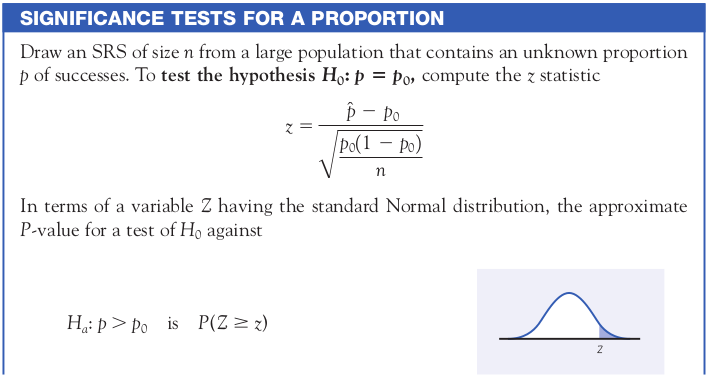
Example: We hear that newborn babies are more likely to be boys than girls, presumably to compensate for higher mortality among boys in early life. Is this true? A random sample found 13,173 boys among 25,468 firstborn children. The sample proportion of boys was $$\hat{p}=\frac{13,173}{25,468}=0.5172.$$ Boys do make up more than half of the sample, but of course we don’t expect a perfect 50-50 split in a random sample. Is this sample evidence that boys are more common than girls in the entire population?