Today we'll learn techniques which will enable us to compare TWO population means.
A Difference of Two Means
Suppose we are comparing two populations with means $\mu_1$ and $\mu_2$.
Question: If we were all-knowing beings and knew that $\mu_1=\mu_2$, what number would we expect the difference of two sample means $\bar{x}_1-\bar{x}_2$ to be close to?
Recall The $t$ Procedures
The $t$ statistic $$t=\frac{\bar{x}-\mu}{s/\sqrt{n}}$$ follows a $t$ distribution.
From the above we get the $t$ confidence interval $$\bar{x} \pm t^* \frac{s}{\sqrt{n}}$$ Big Question: How do we modify this to compare two means?
The Two-Sample $t$ Procedures
Draw two independent SRSs from two normally distributed populations.
The Two-Sample $t$ statistic is $$t=\frac{\bar{x}_1-\bar{x}_2}{\sqrt{\frac{s_1^2}{n_1}+\frac{s_2^2}{n_2}}}$$
The Two-Sample $t$ statistic follows what kind of distribution?
The Two-Sample $t$ Confidence Interval:
Draw an SRS of size $n_1$ from a large Normal population with unknown mean $\mu_1$, and draw an independent SRS of size $n_2$ from another large Normal population with unknown mean $\mu_2$. A level $C$ confidence interval for $\mu_1 - \mu_2$ is given by $$\bar{x}_1-\bar{x}_2 \pm t^* \sqrt{\frac{s_1^2}{n_1}+\frac{s_2^2}{n_2}}$$ where $t^*$ is the critical value from the $t$-distribution corresponding to $C$.
The Two-Sample $t$ Test
To test the hypothesis $H_0: \mu_1=\mu_2$, compute the Two-Sample $t$ test statistic $$t=\frac{\bar{x}_1-\bar{x}_2}{\sqrt{\frac{s_1^2}{n_1}+\frac{s_2^2}{n_2}}}$$
The $p$-value of this test statistic is the degree of evidence against the null hypothesis.
Just One Little Problem
For the Two-Sample $t$, which $t$ distribution do we use?
In other words, how many degrees of freedom do we use?
D:
Two Answers
Option 1: Use software which computes degrees of freedom ($df$) from a messy formula.
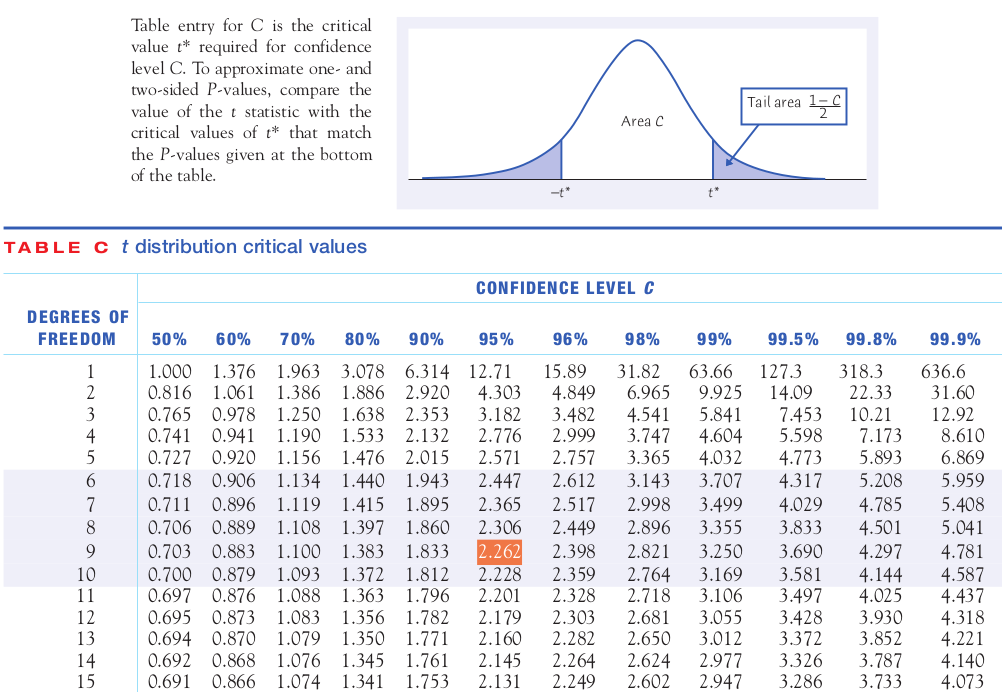
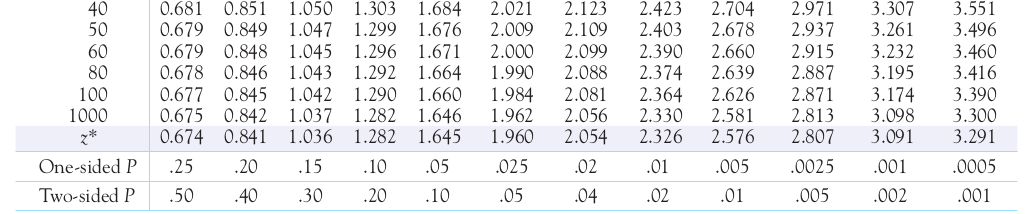
Option 2: Table C in Your Text using $$df=\min\{n_1-1,n_2-1\}.$$
Yes, We're Way Overdue for an Example...
Daily Activity and Obesity
To investigate a possible link between obesity and energy spent on daily activity, Mayo Clinic researchers gathered the following data on 20 individuals over 10 days.
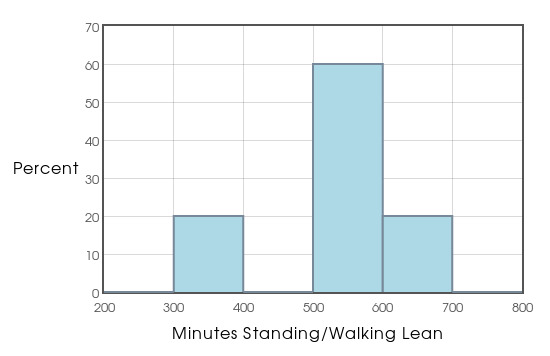
Minutes Walking/Standing over 10 Days for the lean group are: 511.1 607.925 319.212 584.644 578.869 543.388 677.188 555.656 374.831 504.7
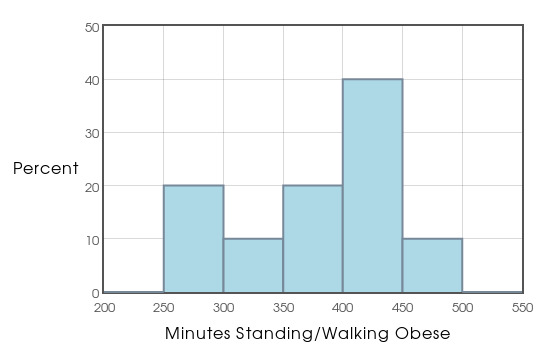
Minutes Walking/Standing over 10 Days for the obese group are: 260.244 464.756 367.138 413.667 347.375 416.531 358.65 267.344 410.631 426.356
Is this evidence that, on average, lean people spend more time on their feet than obese people?
Important Question: Can we justify using the $t$ procedures?


Example: Calculate a 95% confidence interval for the difference of means using Option 2.
Example: Use software to calculate a 95% confidence interval for the data.
Example: Carry out a test of significance on the standing/walking data.
What are the null and alternative hypotheses?
You should be able to do it by
- Using Table C
- With Software
Using Table C:
$\vdots$
Using software.
Pop Quiz: Who remembers what that robust means as a statistical term?
Robustness of the Two-Sample $t$ Procedures
- The two-sample $t$ procedures require that both our samples are independent SRSs taken from both populations. Conclusions are NOT trustworthy if this condition is not met.
- Sample Size Sum $\lt$ 15: must be able to assume normal distribution, i.e., symmetric with one peak and no outliers.
- Sample Size Sum $\geq$ 15: the $t$ procedures can be trusted if there are no outliers and the distribution is not obviously skewed.
- Sample Size Sum $\geq$ 40: you may use $t$ procedures even if your distributions appear to be skewed.
- The Two-Sample $t$ procedures are more robust against non-normal data when the sample sizes of both samples are equal. Therefore, when planning a two-sample study, try to choose equal sample sizes.