Recall Big-Time-Super-Important Vocab:
A parameter is a numerical fact about a population.
A statistic is a value we compute from a sample of our population.
Drawing conclusions about a population from a sample is called...
Estimating Parameters: Confidence Intervals
We are now beginning to ride the crest of the statistical wave, folks!
We know how to compute sample means, but how do we know how good our estimate is?
Estimating Parameters: Confidence Intervals
When we estimate a parameter with a sample statistic (in this case, the sample mean), we want to know how good our estimate is.
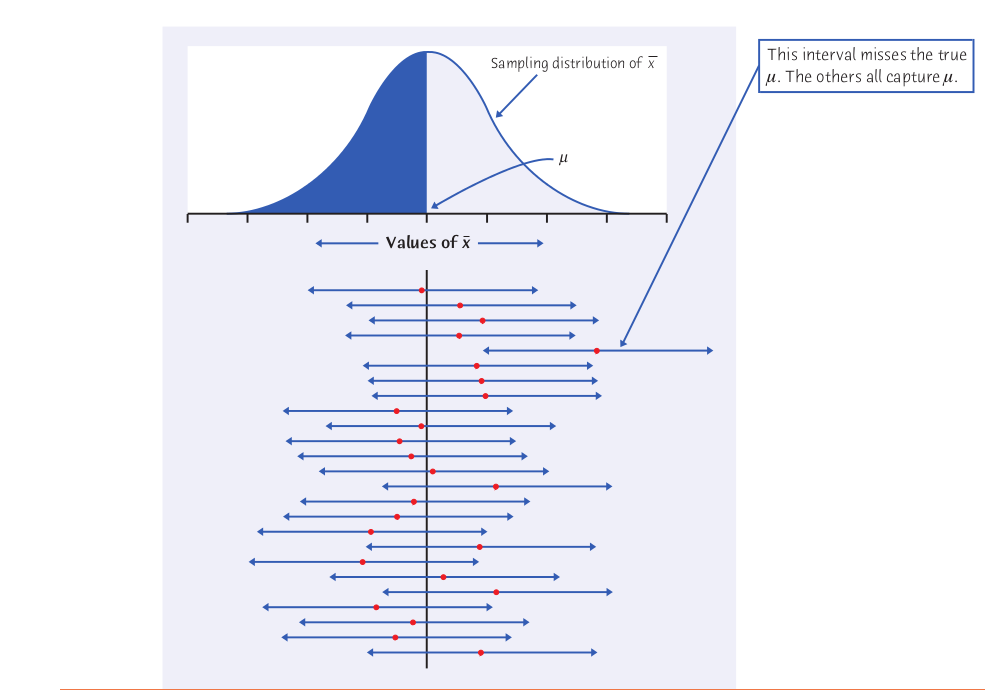
So we construct an interval that captures the true parameter a known percentage the time (i.e, with a known probability).
The interval has the form $$\mbox{estimate} \pm \mbox{margin of error}$$ The details of calculating the margin of error will be one of the focuses of this course.
Example: Calculating a confidence interval for the true population mean.
Sample Size: $n=$
Confidence Level: %
$\bar{x}=$ $\mbox{Margin of Error}=\pm$ Confidence Interval:
Calculating the Margin of Error
Suppose we draw a simple random sample of size $n$ from a population with mean $\mu$ and standard deviation $\sigma$.
Big Question: Who remembers how the sample means $\bar{x}$ are distributed?
Big Hint: Chicken Lettuce Tomato. ;)
Let's draw a normal curve with mean $\mu$ and standard deviation $\sigma/\sqrt{n}$.
Thus, $$P(\mu-1.96\frac{\sigma}{\sqrt{n}}<\bar{x}<\mu+1.96\frac{\sigma}{\sqrt{n}})=0.95.$$
Performing some algebraic shenanigans, this is equivalent to
$$P(\bar{x}-1.96\frac{\sigma}{\sqrt{n}}<\mu<\bar{x}+1.96\frac{\sigma}{\sqrt{n}})=0.95$$
HUGE Question What is the significance of the above probability statement????
HUGE Answer: The value $1.96\frac{\sigma}{\sqrt{n}}$ is the margin of error for the 95% confidence interval!
In other words: when we calculate the sample mean $\bar{x}$, there is a 95% chance that the true population mean $\mu$ is between the values $$\bar{x}-1.96\frac{\sigma}{\sqrt{n}} \mbox{ and } \bar{x}+1.96\frac{\sigma}{\sqrt{n}}.$$
Important Vocab and Notation:
Draw a simple random sample of size $n$ from a population with mean $\mu$ and standard deviation $\sigma$, then the 95% confidence interval for the mean $\mu$ is
$$(\bar{x}-1.96\frac{\sigma}{\sqrt{n}}, \bar{x}+1.96\frac{\sigma}{\sqrt{n}}).$$
A Kind of Pesky Question: What if we wanted a 99% confidence interval?
A Sort of Nice Answer: We wouldn't have used the value of $1.96$ in our calculation. Instead, we would have used $2.576$.
Why, you ask? Because on a standard normal curve 99% percent of all observations lie between $-2.576$ and $2.576$.
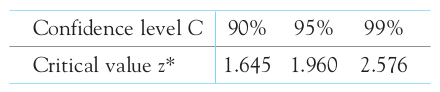
The value of $z$ on the standard normal table which which captures some percentage (i.e., 95%, 99%, etc.) of of all values is denoted $z^*$.
A modest table of values of $z^*$:
General Confidence Interval
Choose the value of $z^*$ corresponding to $C\%$, and the $C\%$ confidence interval is $$(\bar{x}-z^{*}\frac{\sigma}{\sqrt{n}}, \bar{x}+z^{*}\frac{\sigma}{\sqrt{n}}).$$
A Truly Pesky Question: We don't know $\mu$. How do we know $\sigma$?
One More (I promise) Irritating Quesion: Are the $\bar{x}$'s exactly normally distributed?
CLT starts to really kick in at about $n>30$, so these calculations really require larger sample sizes to be considered trustworthy.
Otherwise, if your sample size is less than 30, you need to convince yourself and your readers that your simple random sample came from a normally distributed population.
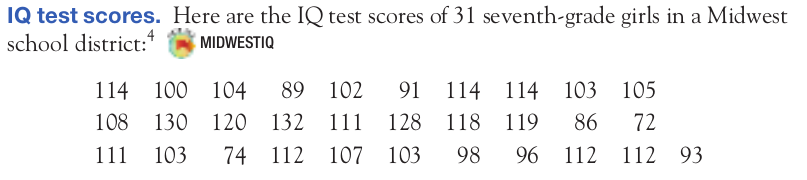
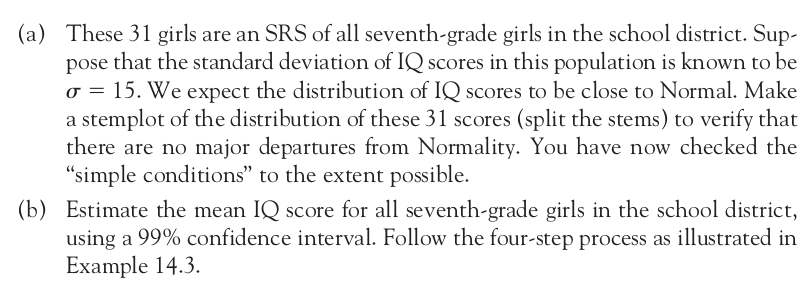
Example