Some Big-Time-Super-Important Vocab:
A parameter is a numerical fact about a population.
A statistic is a value we compute from a sample of our population.
We very often use statistics to estimate parameters. Who remembers what this is called?
A Step Toward Inference: The Law of Large Numbers
Draw observations at random from any population with true mean $\mu$. As the number of observations drawn increases, the mean $\bar{x}$ of the observed values gets closer and closer to the mean $\mu$ of the population.
Draw observations at random from any population with true mean $\mu$. As the number of observations drawn increases, the mean $\bar{x}$ of the observed values gets closer and closer to the mean $\mu$ of the population.
Example: A Uniform Distribution.
How many uniform random numbers:
$\bar{x}=$
Sampling Distributions
The population distribution of a variable is the distribution of values of the variable among all the individuals in the population.
The sampling distribution of a statistic is the distribution of values taken by the statistic in all possible samples of the same size from the same population.
The Sampling Distribution of $\bar{x}$
A Big Fact: Suppose that $\bar{x}$ is the mean of an SRS of size $n$ drawn from a large population with mean $\mu$ and standard deviation $\sigma$. Then the sampling distribution of $\bar{x}$ has mean $\mu$ and standard deviation $\sigma/\sqrt{n}$.
Consequence: Because the mean of the distribution of $\bar{x}$'s is equal to $\mu$, we say that the statistic $\bar{x}$ is an unbiased estimator of the unknown parameter $\mu$.
The Sampling Distribution of $\bar{x}$
Example: Let's look at the sampling distribution of $\bar{x}$ for a uniform random variable. We'll use our stats suite.
$n=$
$\bar{x}=$
A HUGE Result : The Central Limit Theorem.
Draw an SRS of size $n$ from any population with mean $\mu$ and standard deviation $\sigma$. The central limit theorem says that when $n$ (the sample size) is large, the sampling distribution of the sample mean $\bar{x}$ is approximately Normal $$N(\mu,\frac{\sigma}{\sqrt{n}})$$ Big Deal: The central limit theorem allows us to use Normal probability calculations to answer questions about sample means from many observations even when the population distribution is not Normal.
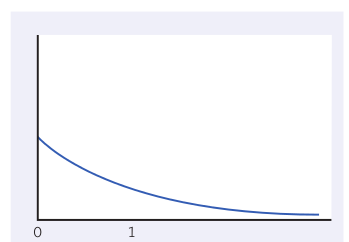
Another Example of CLT
The distribution below is a very non-normal distribution with $\mu=1$
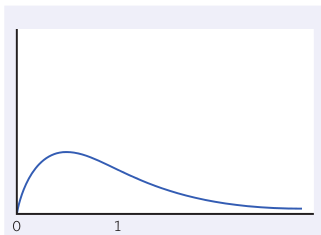
The distribution of $\bar{x}$ for samples of size 2.
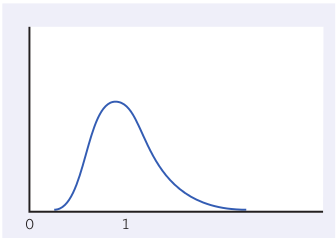
The distribution of $\bar{x}$ for samples of size 10.
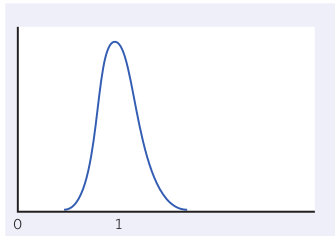
The distribution of $\bar{x}$ for samples of size 25.
In Summary
Because sampling distributions of $\bar{x}$ have a mean of the unknown parameter $\mu$, with a known standard deviation, we can estimate the parameter $\mu$ by $\bar{x}$.
Since the standard deviation of a sampling distribution for $\bar{x}$ is $\sigma/\sqrt{n}$, we know that our estimate gets better and better as the sample size $n$ increases.
For larger sample sizes, The Central Limit Theorem allows us to approximate the sampling distribution of $\bar{x}$ with a normal distribution, even if the population distribution is non-normal.
For large sample sizes, we can simply use the techniques we used for normal distributions we learned in Chapter 3.