Mr. Holt has a coin (below) which may or not be fair. Let's toss it $20$ times and decide if we think it's fair or not.
Coin Flip:
Recall: The sampling distribution of $\hat{p}:$
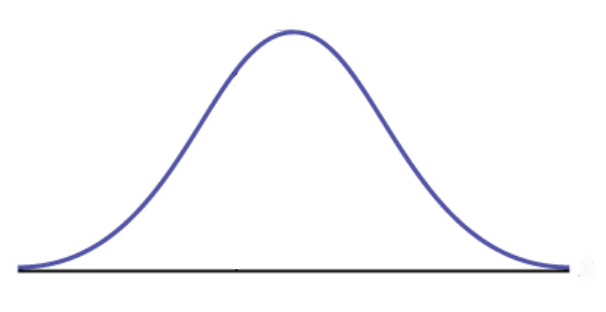 $$\hat{p} \sim N\left(p,\sqrt{\frac{p(1-p)}{n}}\right)$$
In Our Case...
If we suppose Mr. Holt's coin is fair, then the sampling distribution of $\hat{p}$ for tosses should be close to The Big Question: Given that the above is our distribution (i.e., Mr. Holt's coin is fair), what are the chances of observing the number of heads we observed?
Answer: Since we have that We can get the above $p\mbox{-value}$ with our $z$-table.
In Summary... We just performed a hypothesis test!
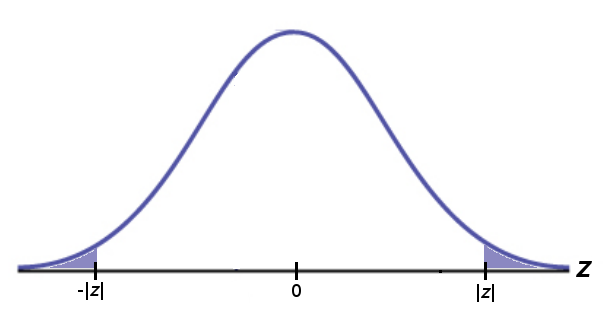
Depending on our level of significance, we answered the question of whether or not we think Mr. Holt's coin is fair. That is, is the true proportion $p$ of heads $0.5,$ or something different? $$\begin{array}{c} H_0: p=0.5 \\ H_a: p\neq 0.5 \end{array}$$
Hypothesis Test for an Unknown Proportion
Step 0: Decide your level of significance $\alpha.$
Step 1: State your hypotheses: $H_0: p=p_0$ and $H_a:\begin{array}{c} p \neq p_0 \\ p \gt p_0 \\ p \lt p_0 \end{array}.$
Step 2: Compute the test statistic $\displaystyle z=\frac{\hat{p}-p_0}{\displaystyle \sqrt{\frac{p_0(1-p_0)}{n}}}.$
Step 3: Determine your $p\mbox{-value}.$ (Not to be confused with $p$ or $\hat{p}!$)
Step 4: State your conclusion (keep or reject $H_0$). If your $p\mbox{-value}$ falls below the significance level $\alpha,$ then we reject $H_0.$ Otherwise, we keep $H_0$. Also, summarize the conclusion using the language of the problem situation.
Caveat: These techniques are trustworthy when the expected number of successes and failures under the null hypothesis ARE BOTH $10$ or more.
That is, when $$n p_0 \geq 10 \mbox{ and } n(1-p_0) \geq 10.$$
Example: Do people tend to prefer the first choice presented to them?
To study this question, researchers gave each subject in a study a sampling of two wines with each option presented in a random order. The subjects were then asked to choose their preferred wine. However, unknown to the subjects, both wines were the same.
Suppose that out of a random sample of $61$ subjects, $38$ chose the first wine.
As a researcher, you suspect that people tend to prefer the first wine more often than the second wine despite there being no real difference between the two. To test your suspicion, you carry out a test of significance on your data at the $\alpha=0.05$ level.
Step 1: State hypotheses: $$\displaystyle \begin{array}{c} H_0: p=0.5 \\ H_a: p>0.5 \end{array}$$
Step 2: Compute test-stat.
Since $\hat{p}=\frac{38}{61}$ to three decimal places, we have
$$\displaystyle z=\frac{\hat{p}-p_0}{\displaystyle \sqrt{\frac{p_0(1-p_0)}{n}}}=\frac{\displaystyle \frac{38}{61}-0.5}{\displaystyle \sqrt{\frac{0.5(1-0.5)}{61}}}=1.92$$
Step 3: Determine $p\mbox{-value}$
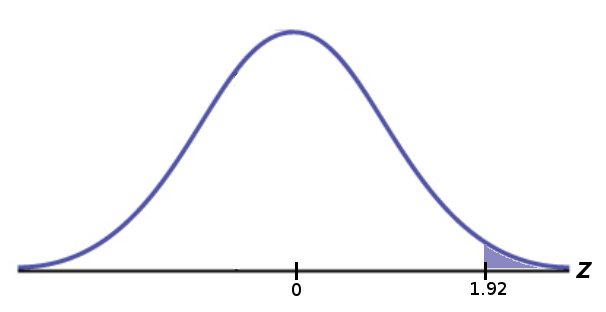
From the Table A we see that $$p\mbox{-value}=P(z>1.92)=P(z<-1.92)=0.0274.$$
Step 4: State conclusion.
At the $\alpha=0.05$ level of significance, we reject $H_0.$
In the language of the problem situation: We have significant evidence that people tend to prefer the first wine more often than the second wine.
Not So Fast! Can we trust the results?
Remember the Caveat: These techniques are trustworthy when the expected number of successes and failures under the null hypothesis ARE BOTH $10$ or more.
That is, when $$n p_0 \geq 10 \mbox{ and } n(1-p_0) \geq 10.$$ In this situation: $61 \cdot 0.5 =30.5 \geq 10,$ and $61 \cdot (1-0.5) =30.5 \geq 10.$
Whew! We can trust the conclusion.
Question: Are the results significant at the $\alpha=0.01$ level?
Example: Toastmasters International cites a report by Gallop Poll that $40\%$ of Americans fear public speaking.
A student Southwestern student believes that less than $40\%$ of students at her school fear public speaking. She randomly surveys $26$ schoolmates and finds that $14$ report they fear public speaking.
At the $\alpha=0.05$ level, does she have significant evidence that the true proportion of students who fear public speaking is less than $0.4?$
Step 1: State hypotheses: $$\displaystyle \begin{array}{c} H_0: p=0.4 \\ H_a: p<0.4 \end{array}$$
Step 2: Compute test-stat.
Since $\hat{p}=\frac{14}{26}=\frac{7}{13}$ to three decimal places, we have
$$\displaystyle z=\frac{\hat{p}-p_0}{\displaystyle \sqrt{\frac{p_0(1-p_0)}{n}}}=\frac{\displaystyle \frac{7}{13}-0.4}{\displaystyle \sqrt{\frac{0.4(1-0.4)}{26}}}=1.44$$
Step 3: Determine $p\mbox{-value}$
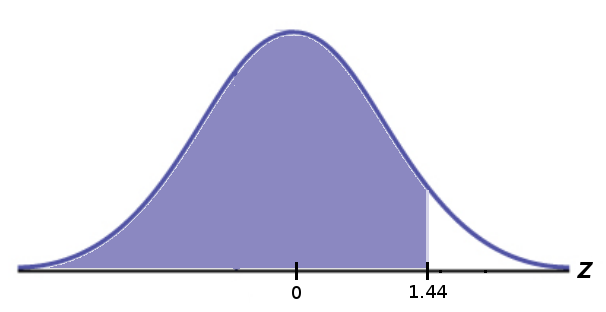
From the Table A we see that $$p\mbox{-value}=P(z<1.44)=0.9251.$$
Step 4: State conclusion.
At the $\alpha=0.05$ level of significance, we keep $H_0.$
In the language of the problem situation: We do not have have significant evidence that less than $40\%$ of Southwestern students fear public speaking.
Remember the Caveat: These techniques are trustworthy when the expected number of successes and failures under the null hypothesis ARE BOTH $10$ or more.
That is, when $$n p_0 \geq 10 \mbox{ and } n(1-p_0) \geq 10.$$ In this situation: $26 \cdot 0.4 =10.4 \geq 10,$ and $26 \cdot (1-0.4) =15.6 \geq 10.$
Yes, we can trust the conclusion.
Coin Flip (Revisited):
Let probability of heads be .
$$\begin{array}{c} H_0: p=0.5 \\ H_a: p \neq 0.5 \end{array}$$
$$\begin{array}{c} H_0: p=0.5 \\ H_a: p \neq 0.5 \end{array}$$