Recall: for a sample of size $n,$ the $t$-statistic $\displaystyle t=\frac{\bar{x}-\mu}{s/\sqrt{n}}$ follows a $t$-distribution with $n-1$ degrees of freedom.
Hypothesis Test for an Unknown Mean ($\sigma$ Unknown)
Step 0: Decide your level of significance $\alpha.$
Step 1: State your hypotheses: $H_0: \mu=\mu_0$ and $H_a:\begin{array}{c} \mu \neq \mu_0 \\ \mu \gt \mu_0 \\ \mu \lt \mu_0 \end{array}.$
Step 2: Compute the test statistic $\displaystyle t=\frac{\bar{x}-\mu_0}{s/\sqrt{n}}.$
Step 3: Determine your $p\mbox{-value}.$
Step 4: State your conclusion (keep or reject $H_0$). If your $p\mbox{-value}$ falls below the significance level $\alpha,$ then we reject $H_0.$ Otherwise, we keep $H_0$. Also, summarize the conclusion using the language of the problem situation.
Note: Instead of calculating a $p\mbox{-value}$ directly, you may need to use the $t^*$-table to trap your $p\mbox{-value}.$
We will learn how to do this in the next examples.
On the other hand, a TI-83/84 will calculate $p\mbox{-values}$ for you.
For homework, you may always use Holt.Blue .
Example: Billy Bob recently purchased a brand new car. In order to estimate his average gas mileage, over several months Billy Bob has recorded the following $n=26$ mileages between each fill-up:
31.23, 25.09, 30.88, 27.72, 23.68, 22.69, 29.83, 28.29, 26.69, 28.36, 25.95, 27.18, 32.67, 25.71, 30.38, 36.8, 22.32, 30.16, 28.73, 32.65, 24.27, 28.45, 27.77, 29.41, 28.79, 29.8
The manufacturer of the vehicle Billy Bob purchased reports that the average gas mileage is $30.1$ MPG. However, Billy Bob suspects that the true mean gas mileage $\mu$ of his car is not the same as the one reported by the manufacturer. To test his suspicion, Billy Bob carries out a test of significance with $\alpha=0.01$.
Step 1: State hypotheses: $$\displaystyle \begin{array}{c} H_0: \mu=30.1 \\ H_a: \mu \neq 30.1 \end{array}$$
Step 2: Compute test-stat: $$\displaystyle t=\frac{\bar{x}-\mu_0}{s/\sqrt{n}}=\frac{28.2885-30.1}{3.2947/\sqrt{26}}=-2.804$$
Step 3: Determine $p\mbox{-value}$: Using $t^*$-table at $25$ degrees of freedom
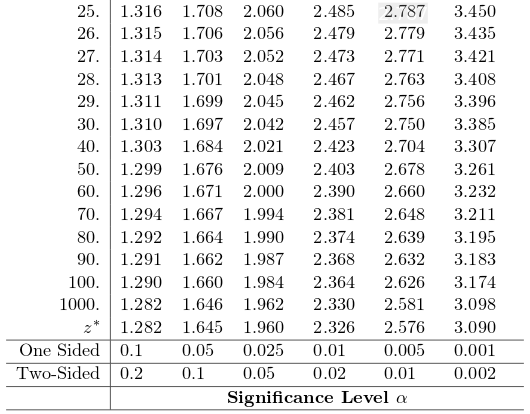
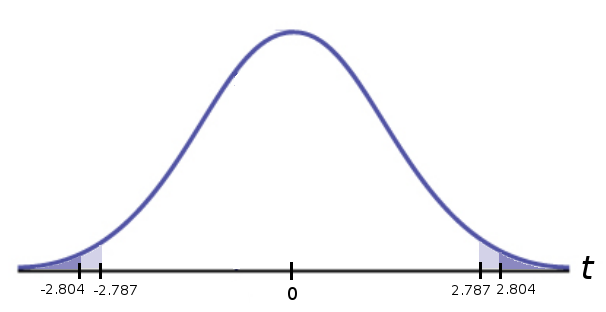
From the table we see that $p\mbox{-value} \lt 0.01$
Step 4: State conclusion: We reject $H_0.$
In the language of the problem situation: Billy Bob has significant evidence that the mean gas mileage of his new vehicle is different than that reported by the manufacturer.
Example: The following are a random sample of $n=24$ IQ scores of seventh-grade students from a school district in Portland:
98, 89, 86, 107, 128, 93, 112, 112, 108, 111, 103, 103, 114, 112, 119, 105, 114, 118, 96, 74, 111, 114, 120, 130
Suppose that a previous estimate of the mean IQ of seventh graders from this school district is $105.$ We suspect that the true value may actually be higher. To test our suspicion, we carry out a test of significance on the data we collected above.
At the $\alpha=0.1$ level of significance, what is the conclusion?
Step 1: State hypotheses: $$\displaystyle \begin{array}{c} H_0: \mu=105 \\ H_a: \mu>105 \end{array}$$
Step 2: Compute test-stat: $$\displaystyle t=\frac{\bar{x}-\mu_0}{s/\sqrt{n}}=\frac{107.375-105}{13.0943/\sqrt{24}}=0.889$$
Step 3: Determine $p\mbox{-value}$: Using $t^*$-table at $23$ degrees of freedom
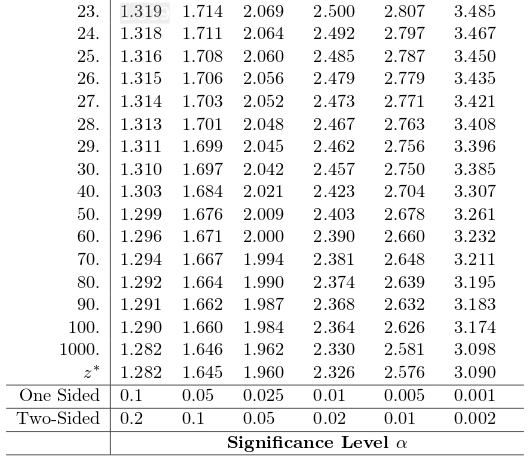
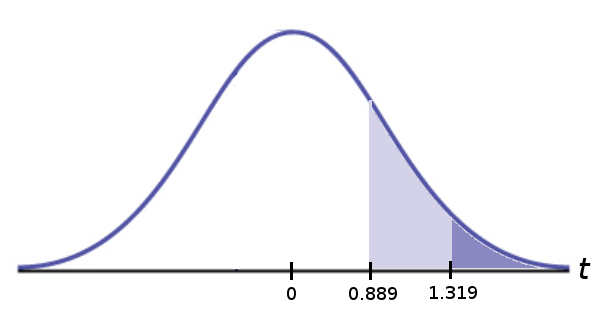
From the table we see that $p\mbox{-value} \gt 0.1$
Step 4: State conclusion: We keep $H_0.$
In the language of the problem situation: There is no significant evidence that the mean IQ of seventh graders from this district is greater than $105.$
Example: Human breast milk is rich in calcium. A researcher suspects that some of this calcium is the result of bone mineral loss in breast feeding mothers.
Suppose that the percent change in bone mineral in a random sample of $n=46$ breastfeeding mothers is:
−6.2%, −2.5%, −3.3%, −5.2%, −4.9%, −4.7%, −4.7%, −0.3%, −4.9%, −2.1%, −8%, −2.5%, −5.2%, −0.8%, −5.9%, −3%, −2.2%, 1.7%, −1.8%, −2.3%, −5.6%, −3.6%, −2.2%, −2.7%, −7.8%, −3.1%, −2.1%, 0.3%, −8.3%, 2.2%, −6.8%, −5.3%, −2%, −1%, −4%, −6.5%, 0.2%, 0.4%, −5.3%, −4.4%, −1%, −3.8%, −7%, −6.8%, −6.5%, −5.1%
Suppose that previous research suggests that the mean mineral loss in breast-feeding mothers is $−2.9\%.$ However, we suspect that the true value of the mean mineral loss $\mu$ may actually be lower (more negative). At the $\alpha=0.05$ level of significance, what is the conclusion?
Step 1: State hypotheses: $$\displaystyle \begin{array}{c} H_0: \mu=-2.9\% \\ H_a: \mu<-2.9\% \end{array}$$
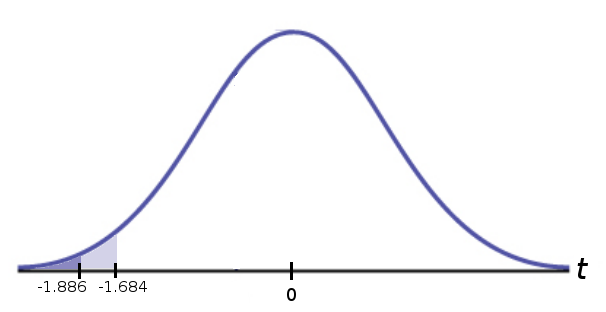
Step 2: Compute test-stat: $$\displaystyle t=\frac{\bar{x}-\mu_0}{s/\sqrt{n}}=\frac{-3.6217-(-2.9)}{2.5959/\sqrt{46}}=-1.886$$
Step 3: Determine $p\mbox{-value}$: We would like to use the Table B for $df=n-1=45,$ but we cannot do this since there is no entry for $45.$ So, we must round down to $40.$ This will give us an a slight overestimate of our $p$-value. (To choose $df=50$ could underestimate the $p$-value, which would be dishonest.)
Using $t^*$-table at $40$ degrees of freedom
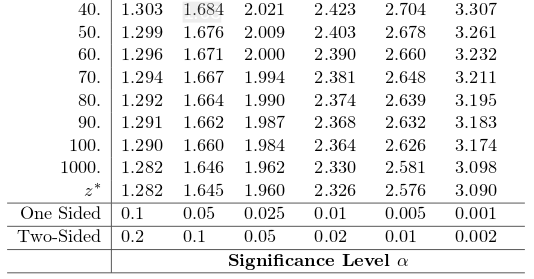
From the table we see that $p\mbox{-value} \lt 0.05$
Step 4: State conclusion: We reject $H_0.$
In the language of the problem situation: There is significant evidence that the mean mineral loss in the bones of breast-feeding mothers is less than $-2.9\%.$
Robustness of the $t$ Procedures
Vocab: A statistical procedure is called robust if violations of its initial assumptions cause little change in the results (e.g., $p\mbox{-values}$.)
The Fine Print: When is it appropriate to use the $t$-procedures?
$n \lt 15:$ Use $t$ procedures if the assumption of normality cannot be ruled out and there are no outliers. If there is any evidence of non-normality do not use the $t$-procedures. There are really good alternatives here which should be used instead.
$n\geq 15:$ The $t$ procedures can be used except when there are outliers or there is evidence of a skewed distribution. For these exceptions, again, there are alternatives which should be used instead.
$n \geq 40.$: The $t$ procedures produce good results even for distributions with evidence of skew.
If any of the above fail, use alternative methods.
Extra! Read All About It! Squaresville is Short!
Below is the height of all the citizens of Squaresville.
The true mean height is $\mu=$ inches, but a journalist reports that the true mean is
$\mu_0=$ inches.
We're skeptical of this claim, so we randomly sample
citizens and run a test of significance at the $\alpha=$ level.
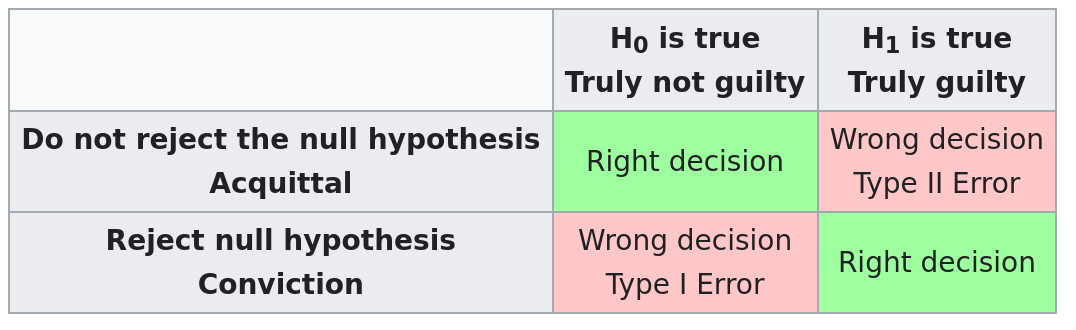
Type I Errors
If we reject $H_0$ when it's really true, this is called a Type I Error.
A.K.A.: "false positive."
Legal analogy: "an innocent person is convicted."
The probability of making a Type I Error is precisely our level of significance, $\alpha.$
Type II Errors
If we keep $H_0$ when it's truly false, this is called a Type II Error.
A.K.A.: "false negative."
Legal analogy: "a guilty person goes free."
The power of a test is its ability to detect a difference when one exists. More formally, $$\mbox{Power}=P(\mbox{Reject $H_0$}|\mbox{$H_a$ is true})$$ The probability of making a Type II Error is precisely $1-\mbox{Power}.$
Bonus Example
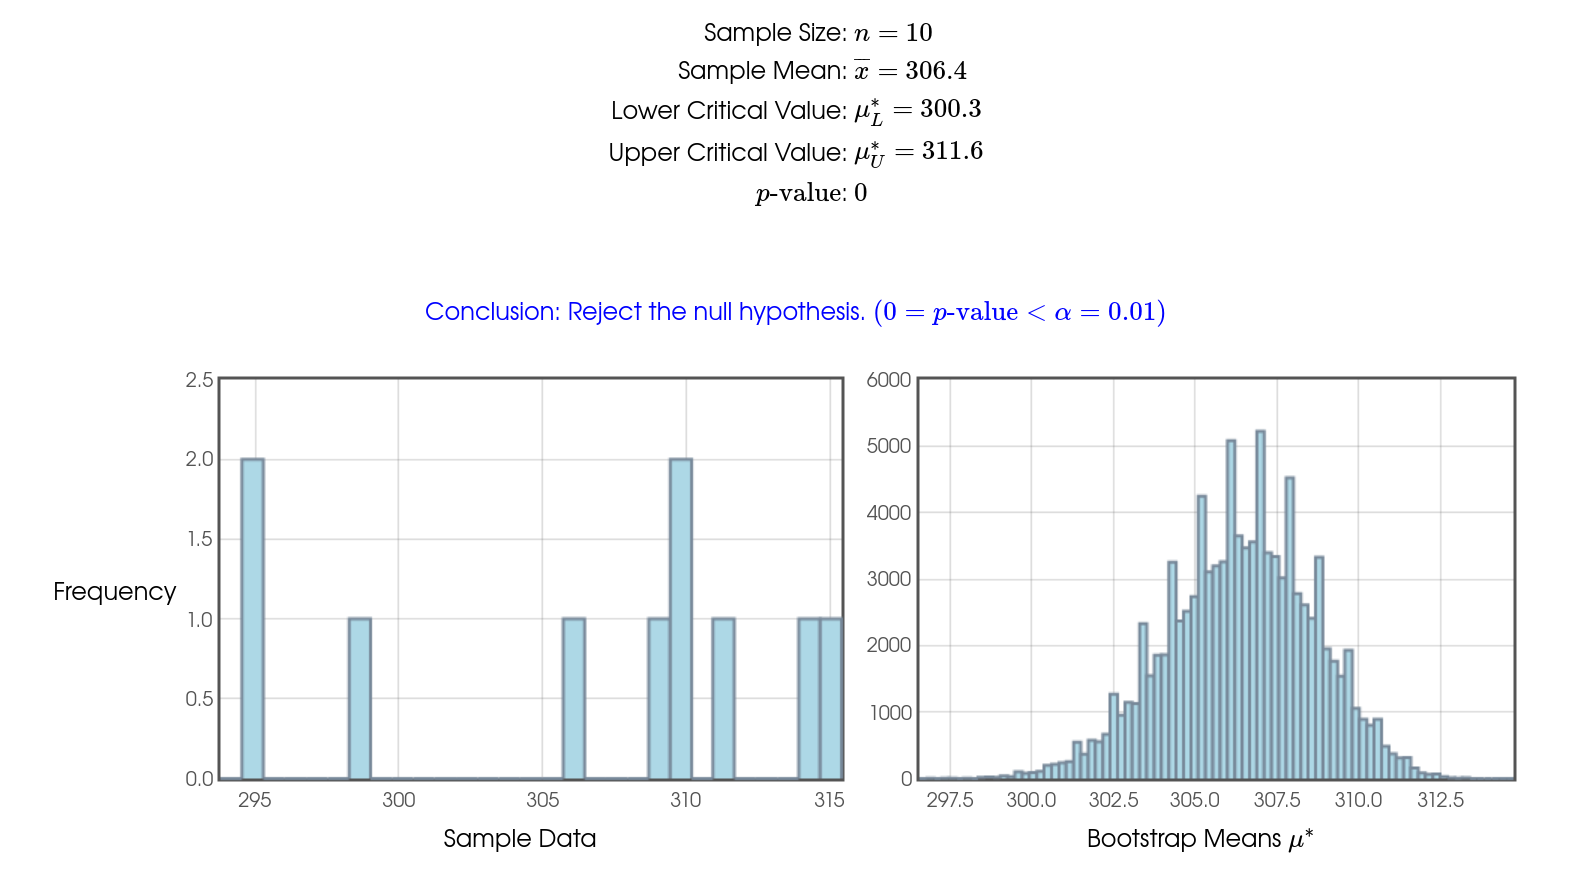
Mr. Holt loves a certain brand of Mango Slices. He notices that the net weight of the product is $284$ grams and is interested to see how close a typical bag comes to this reported net weight. So, over several weeks, he collects the following data in grams: $$ 311, 295, 295, 299, 314, 315, 309, 310, 310, 306 $$ Carry out a test of significance on this data to test if the population mean differs significantly from $284$ grams at the $\alpha=0.01$ level.


Step 1: State hypotheses: $$\displaystyle \begin{array}{c} H_0: \mu=284 \\ H_a: \mu \neq 284 \end{array}$$
Step 2: Compute test-stat: $$\displaystyle t=\frac{\bar{x}-\mu_0}{s/\sqrt{n}}=\frac{306.4-284}{7.4565/\sqrt{10}}=9.4997$$
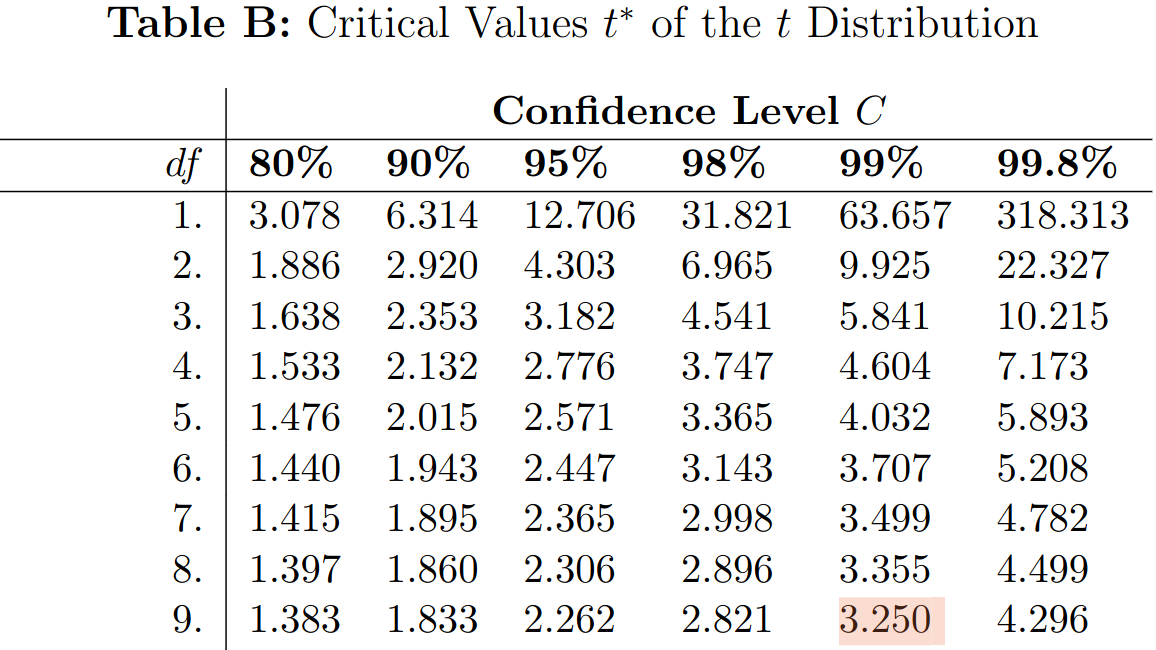
Step 3: Determine $p\mbox{-value}$: Using $t^*$-table at $9$ degrees of freedom
$\vdots$
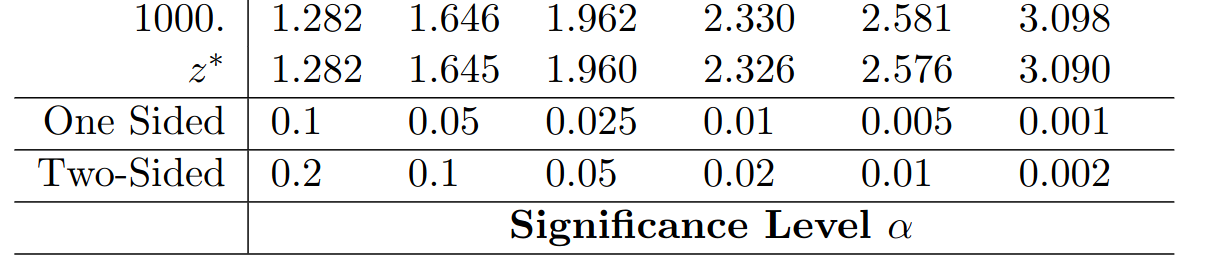
Since $t=9.4997\gt 3.250 =t^*,$ from the table we see that $p\mbox{-value} \lt 0.01$
Note: You may use software to compute your $p$-value.
Step 4: State conclusion: We reject $H_0.$
In the language of the problem situation: We have significant evidence that the mean weight of a typical bag of mango slices is different than $284$ grams. In particular, the mean is higher than $284.$ There are certainly no shenanigans going on here.
Important Question
Revisiting Mr. Holt's Mango-Slice data, was it safe to use the $t$-procedures?
With a small sample size of $10,$ we should definitely proceed with caution.
Looking at the histogram of our data, we see that there don't appear to be any outliers, and the $1.5 \cdot IQR$ rule confirms this.
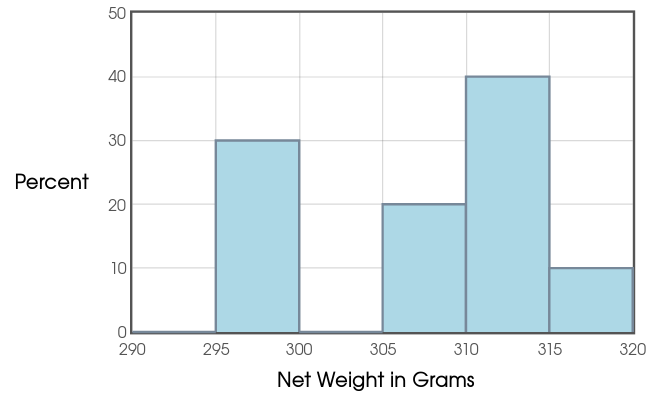 Moreover, we cannot rule out normality. So, especially given that no data values were even close to the reported net weight of $284$ grams, it appears that we are safe.
That said, if we still don't trust the results, we have two options:
Looking at the histogram of our data, we see that there don't appear to be any outliers, and the $1.5 \cdot IQR$ rule confirms this.
That said, if we still don't trust the results, we have two options:
- Collect more delicious data! (Yum!)
- Use alternative, non-parametric methods.