Let's Recall the Basics of a Hypothesis Test
Hypothesis Test for an Unknown Mean ($\sigma$ Known)
Step 0: Decide your level of significance $\alpha.$
Step 1: State your hypotheses: $H_0: \mu=\mu_0$ and $H_a:\begin{array}{c} \mu \neq \mu_0 \\ \mu \gt \mu_0 \\ \mu \lt \mu_0 \end{array}.$
Step 2: Compute the test statistic $\displaystyle z=\frac{\bar{x}-\mu_0}{\sigma/\sqrt{n}}.$
Step 3: Determine your $p\mbox{-value}.$
Step 4: State your conclusion (keep or reject $H_0$). If your $p\mbox{-value}$ falls below the significance level $\alpha,$ then we reject $H_0.$ Otherwise, we keep $H_0$. Also, summarize the conclusion using the language of the problem situation.
Example: Human breast milk is rich in calcium. A researcher suspects that some of this calcium is the result of bone mineral loss in breast feeding mothers.
Suppose that the percent change in bone mineral in a random sample of $n=35$ breast feeding mothers is:
−2%, −5.2%, 0.3%, −2.2%, −5.6%, −1%, 2.2%, −2.5%, 0.2%, −4.9%, −6.2%, −3.3%, −1%, −4.4%, −6.5%, −8%, −6.5%, −4.9%, −4.7%, −4.7%, −0.8%, 0.4%, −4%, −5.2%, −3.1%, −2.1%, −3%, −2.2%, −2.5%, −7%, −3.8%, −2.1%, −5.3%, −5.3%, −2.3%
Suppose previous research suggests that the mean mineral loss in breast-feeding mothers is $−2.5\%$ with a standard deviation of $\sigma=2.5\%.$ However, we suspect that the true value of the mean mineral loss $\mu$ may be lower (more negative). To test our suspicion, we carry out a test of significance at the $\alpha=0.05$ level.
Step #1: We suspect that the true mean may actually be lower than $-2.5\%.$
The null hypothesis says that there is "no effect: the population mean is $-2.5\%,$" whereas the alternative hypotheses
says that "there is something happening: the population mean is lower than $-2.5\%.$"
These hypotheses are expressed as
$$
\begin{array}{c}
H_0: \mu=-2.5\%\\
H_a: \mu \lt -2.5\%
\end{array}
$$
Step #2: From our data set, we have that $\bar{x}=-3.406\%$ and $n=35.$
Our null hypothesis assumes that $\mu=-2.5\%$ and $\sigma=2.5\%.$ From these we
may now compute our test statistic, in this case, the $z$-statistic:
$$
z=\frac{\bar{x}-\mu_0}{\sigma/\sqrt{n}}=\frac{-3.406\%-(-2.5\%)}{2.5\%/\sqrt{35}}=-2.14
$$
to two decimal places.
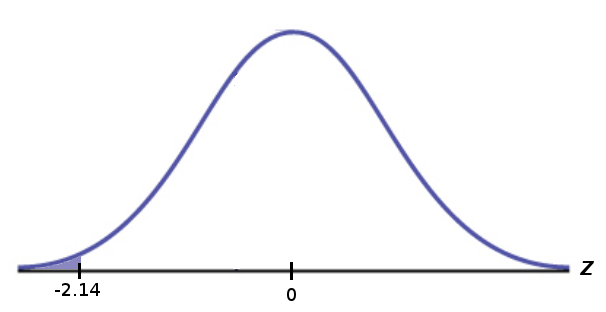
Step #3: The probability of observing a $z$ test statistic of $-2.14$ or lower is $$ P(z \lt -2.14)=.0162 $$ from Table A. Therefore, $p\mbox{-value}=.0162.$
 Step #4: Since our $p\mbox{-value}= .0162 \lt 0.05=\alpha,$ we reject the null hypothesis $H_0$.
In plain language, there is significant evidence that that the mean bone mineral loss in
breast-feeding mothers is lower than than $-2.5\%.$
Step #4: Since our $p\mbox{-value}= .0162 \lt 0.05=\alpha,$ we reject the null hypothesis $H_0$.
In plain language, there is significant evidence that that the mean bone mineral loss in
breast-feeding mothers is lower than than $-2.5\%.$
Step #3: The probability of observing a $z$ test statistic of $-2.14$ or lower is $$ P(z \lt -2.14)=.0162 $$ from Table A. Therefore, $p\mbox{-value}=.0162.$
Question: Are the results significant at the $\alpha=0.01$ level?

Example: The following are a random sample of $n=10$ IQ scores of seventh-grade students from a school district in Portland:
112, 103, 104, 108, 72, 114, 111, 74, 132, 114
Assume that the IQ scores in this population has a normal distribution with standard deviation $\sigma=15.$
Suppose that a previous estimate of the mean IQ $\mu$ of seventh graders from this school district is $103.$ We suspect that the true value may actually be higher. To test our suspicion, we carry out a test of significance on the data we collected above at the $\alpha=0.1$ level.
Step #1: We suspect that the true mean may actually be higher than $103.$
The null hypothesis says that there is "no effect: the population mean is $103,$" whereas the alternative hypotheses
says that "there is something happening: the population mean is higher than $103.$"
These hypotheses are expressed as
$$
\begin{array}{c}
H_0: \mu=103\\
H_a: \mu \gt 103
\end{array}
$$
Step #2: From our data set, we have that $\bar{x}=104.4$ and $n=10.$
Our null hypothesis assumes that $\mu=103$ and $\sigma=15.$ From these we
may now compute our test statistic, in this case, the $z$-statistic:
$$
z=\frac{\bar{x}-\mu_0}{\sigma/\sqrt{n}}=\frac{104.4-103}{15/\sqrt{10}}=0.30
$$
to two decimal places.
Step #3: The probability of observing a $z$ test statistic of $0.30$ or higher is $$ P(z \gt 0.30)=1-P(z \lt 0.30)=1-.6179=0.3821 $$ from Table A. Therefore, $p\mbox{-value}=0.3821.$
 Step #4: Since our $p\mbox{-value}= 0.3821 \gt 0.1=\alpha,$ we keep the null hypothesis $H_0$.
In plain language, there is no significant evidence that the mean IQ $\mu$ of seventh graders from this
school district is higher than $103.$
Step #4: Since our $p\mbox{-value}= 0.3821 \gt 0.1=\alpha,$ we keep the null hypothesis $H_0$.
In plain language, there is no significant evidence that the mean IQ $\mu$ of seventh graders from this
school district is higher than $103.$
Step #3: The probability of observing a $z$ test statistic of $0.30$ or higher is $$ P(z \gt 0.30)=1-P(z \lt 0.30)=1-.6179=0.3821 $$ from Table A. Therefore, $p\mbox{-value}=0.3821.$
Example: Billy Bob recently purchased a brand new car. In order to estimate his average gas mileage, over several months Billy Bob has recorded the following $n=14$ mileages between each fill-up:
30.16, 28.29, 27.77, 22.69, 28.79, 29.41, 22.32, 25.09, 30.88, 27.18, 28.36, 36.8, 28.73, 25.71
The manufacturer of the vehicle Billy Bob purchased reports that the average gas mileage is $25.1$ MPG with a standard deviation of $\sigma=3.5$ MPG. However, Billy Bob suspects that the true mean gas mileage $\mu$ of his car is not the same as the one reported by the manufacturer. To test his suspicion, Billy Bob carries out a test of significance on his data assuming the values of the mean and standard deviation reported by the manufacturer at a significance level $\alpha=0.01.$
Step #1: We suspect that the true mean may actually be different than $25.1.$
The null hypothesis says that there is "no effect: the population mean is $25.1,$" whereas the alternative hypotheses
says that "there is something happening: the population mean is different than $25.1.$"
These hypotheses are expressed as
$$
\begin{array}{c}
H_0: \mu=25.1\\
H_a: \mu \neq 25.1
\end{array}
$$
Step #2: From our data set, we have that $\bar{x}=28.013$ and $n=14.$
Our null hypothesis assumes that $\mu=25.1$ and $\sigma=3.5.$ From these we
may now compute our test statistic, in this case, the $z$-statistic:
$$
z=\frac{\bar{x}-\mu_0}{\sigma/\sqrt{n}}=\frac{28.013-25.1}{3.5/\sqrt{14}}=3.11
$$
to two decimal places.
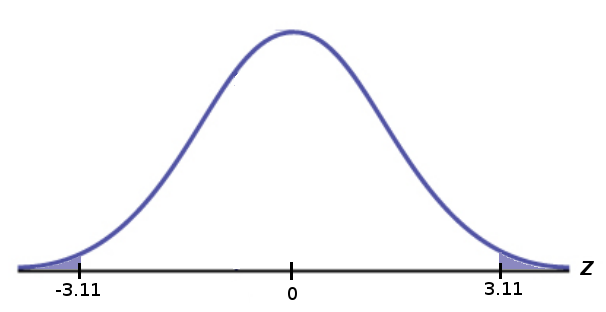
Step #3: The probability of observing a $z$ test statistic as far away from $0$ as $3.11$ is $$ P(|z| \gt 3.11)=2 \cdot P(z \lt -3.11)=2 \cdot .0009=0.0018 $$ from Table A. Therefore, $p\mbox{-value}=0.0018.$
 Step #4: Since our $p\mbox{-value}= 0.0018 \lt 0.01=\alpha,$ we reject the null hypothesis $H_0$.
In plain language, there is significant evidence that the true mean gas mileage
of his car is not the same as the one reported by the manufacturer ($25.1$ MPG).
Step #4: Since our $p\mbox{-value}= 0.0018 \lt 0.01=\alpha,$ we reject the null hypothesis $H_0$.
In plain language, there is significant evidence that the true mean gas mileage
of his car is not the same as the one reported by the manufacturer ($25.1$ MPG).
Step #3: The probability of observing a $z$ test statistic as far away from $0$ as $3.11$ is $$ P(|z| \gt 3.11)=2 \cdot P(z \lt -3.11)=2 \cdot .0009=0.0018 $$ from Table A. Therefore, $p\mbox{-value}=0.0018.$
Question: Are the results significant at the $\alpha=0.05$ level?

Vocab
The first two tests we did above (breastfeeding moms and IQ Scores) are examples of what are called one-sided tests, or one-tailed tests. The reason is that we are interested in whether or not a population mean is only higher or lower than a specified value; we only consider the probability above or below the test statistic we compute.
$\small{H_a: \mu<-2.5\% \leftrightarrow P(z<-2.14)}$
"Lower-Tailed Test"
$\small{H_a: \mu>103 \leftrightarrow P(z>0.30)}$
"Upper-Tailed Test"
Vocab
The third test we did above (Billy Bob's Gas Mileage) is an example of what is called a two-sided test, or a two-tailed test. Since we are interested in whether or not a population mean is different (i.e., EITHER higher or lower) from a specified value. we must look at the probability of seeing a test statistic as extreme or more extreme in EITHER direction.
$\small{H_a: \mu \neq 25.1 \leftrightarrow P(|z|>3.11)=P(z<-3.11 \mbox{ OR } z>3.11)}$
Average Height in Squaresville
Below is the height of all the citizens of Squaresville.
The true mean height is $\mu=$ inches with a standard deviation of $\sigma=$ inches, but a journalist reports that the true mean is
$\mu_0=$ inches.
We're skeptical of this claim, so we randomly sample
citizens and run a test of significance at the $\alpha=$ level.