Recall: Confidence Intervals for $\mu$: $$\bar{x} \pm z^*\frac{\sigma}{\sqrt{n}}$$ This interval is called th $z$ interval because it relies on the standard normal distribution $N(0,1).$
Question: What is a major drawback of the $z$ interval?
Enter the $t$ Distributions
With the $t$-distribution, we don't need to know $\sigma$.
Instead of the population standard deviation $\sigma$, we may simply use the sample standard deviation $s$.
The $t$ Distributions: Draw an SRS from a normally distributed population and compute $\displaystyle t=\frac{\bar{x}-\mu}{s/\sqrt{n}}$. Then the random variable $t$ follows the $t$ distribution with $n-1$ degrees of freedom.
The $t$ distributions are fatter in the tails than the normal distribution.
The Big Deal: We can now fully practice inference for a population mean.
Critical Values of the $t$ Distribution
But before we move on to the serious business of estimating population means...
Question: What is $z^{*}?$
Critical Values of the $t$ Distribution
$t^*$ is the value of $t$ on a $t$ Distribution which gives us the desired level of confidence.
Example: Calculate $t^*$ for $95\%$ confidence with sample size $10$ (i.e., $9$ degrees of freedom).
Method 1: Use Table B.
Method 2: Use Software.
This means either purchasing a statistical software package, or using holt.blue.
You also have the option of using your TI-84 Calculator.
We are now ready to embark upon our inferential journey!
The One-Sample $t$ Confidence Interval
Draw an SRS of size $n$ from a population with unknown mean $\mu$. A $C\%$ confidence interval for $\mu$ is $$\bar{x} \pm t^* \frac{s}{\sqrt{n}}$$ where $t^*$ is the critical value of the $t$ distribution with $n-1$ degrees of freedom.
The One-Sample $t$ Confidence Interval: Interval Notation
Draw an SRS of size $n$ from a population with unknown mean $\mu$. A $C\%$ confidence interval for $\mu$ is $$\left(\displaystyle \bar{x}-t^{*}\frac{s}{\sqrt{n}}, \bar{x}+t^{*}\frac{s}{\sqrt{n}}\right)$$ where $t^*$ is the critical value of the $t$ distribution with $n-1$ degrees of freedom.
Example:
Below is the height of all the citizens of Squaresville.
The true mean height is $\mu=$.
Let's suppose that we don't know this and sample
citizens to estimate the true mean height with the $\%$
confidence interval $\color{red}{\left(\displaystyle \bar{x}-t^{*}\frac{s}{\sqrt{n}}, \bar{x}+t^{*}\frac{s}{\sqrt{n}}\right)}.$
Example: From September $2018$ to February $2019,$ Mr. Holt recorded the following gas mileages of his car at each fill-up: $$ 29.80, 26.69, 28.29, 28.36, 28.73, 25.95, 31.23, 28.45, 27.72, 29.41,\\ 30.88, 25.71, 23.68, 25.09, 32.65, 27.18, 36.80, 30.16, 32.67, 27.77, \\ 24.27, 29.83, 30.38, 22.69, 22.32, 28.79 $$ Calculate a $95\%$ confidence interval for the mean gas mileage using:
- Table B ($\bar{x}=28.2885,$ $s=3.2947,$ and $n=26$)
- holt.blue
- A TI-83/84 Calculator.
To calculate our $95\%$ confidence interval, we use $t^{*}=2.060.$
Then
$$
\begin{array}{ll}
&\left(\displaystyle \bar{x}-t^{*}\frac{s}{\sqrt{n}}, \bar{x}+t^{*}\frac{s}{\sqrt{n}}\right)\\
=&\left(\displaystyle 28.2885-2.060\frac{3.2947}{\sqrt{26}}, 28.2885+2.060\frac{3.2947}{\sqrt{26}}\right)\\
=&(26.957,29.620)
\end{array}
$$
Robustness of the $t$ Procedures
Vocab: A statistical procedure is called robust if violations of its initial assumptions cause little change in the results (e.g., margins of error.)
The Fine Print: When is it appropriate to use the $t$-procedures?
$n \lt 15:$ Use $t$ procedures if the assumption of normality cannot be ruled out and there are no outliers. If there is any evidence of non-normality do not use the $t$-procedures. There are really good alternatives here which should be used instead.
$n\geq 15:$ The $t$ procedures can be used except when there are outliers or there is evidence of a skewed distribution. For these exceptions, again, there are alternatives which should be used instead.
$n \geq 40.$: The $t$ procedures produce good results even for distributions with evidence of skew.
If any of the above fail, use alternative methods.
Important Question
Revisiting Mr. Holt's Gas-Mileage Data, was it safe to use the $t$-procedures?
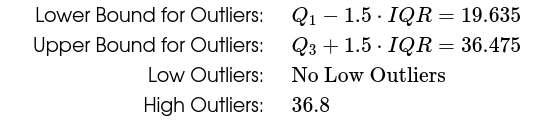
Not entirely. A closer look at the data reveals that an outlier is present, namely the data point $36.80.$
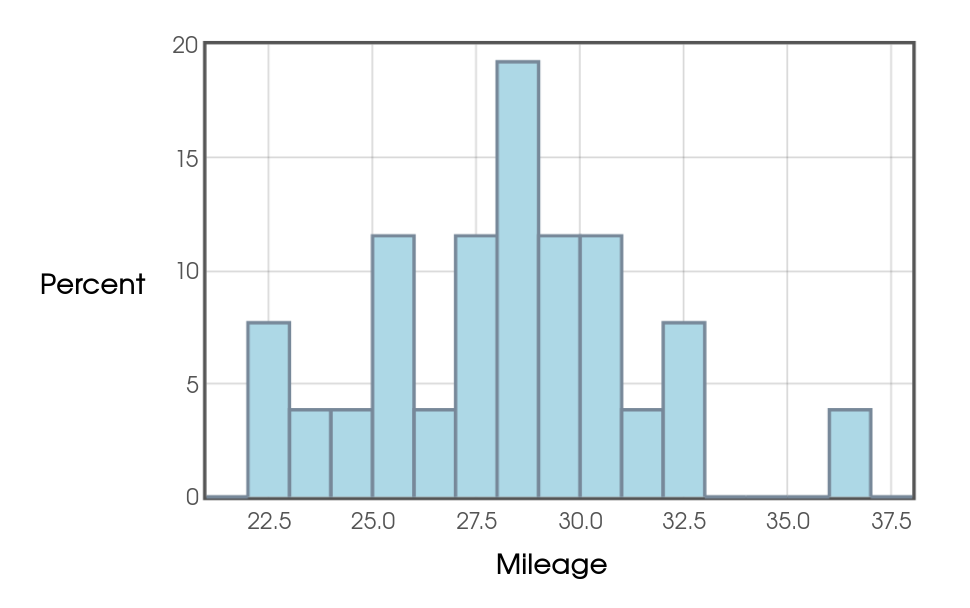
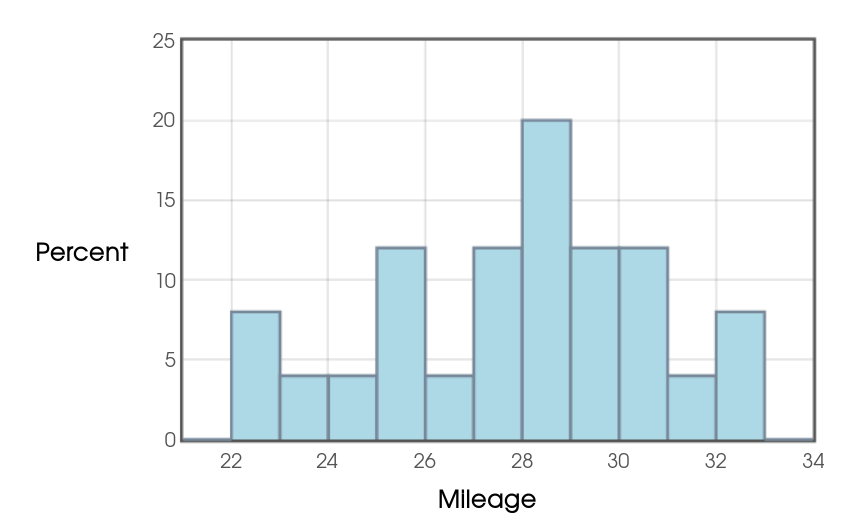
 Without the outlier the data satisfies the above guidelines as seen in the histogram without the outlier.
 The outlier does not appear to be the result of measurement error.
Thus, we cannot justify excluding it from our analysis.
The outlier does not appear to be the result of measurement error.
Thus, we cannot justify excluding it from our analysis.
That said, the outlier is not too extreme as is barely falls outside of the range prescribed by the $1.5\cdot IQR$ rule.
In situations such as these, it is common to run the analysis twice. Once with the outlier, and once without. If the results are similar, we may feel fairly confident in our conclusions, with the caveat that an outlier is present.
The $95%$ interval with the outlier is $(26.957,29.620).$
The $95\%$ interval without the outlier is $(26.768,29.128).$
Since both intervals are very close, we may safely conclude that we are highly confident that the true mean mileage for Mr. Holt's car is somewhere between around $26$ and $29$ miles per gallon.
Example
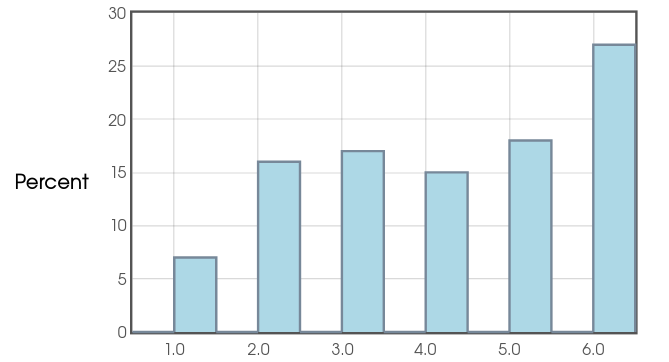
Sleazy P. Martini has a loaded die. Below is the outcome of $100$ consecutive rolls of this die.
5 1 6 5 5 6 4 5 4 3 4 3 5 6 2 3 2 4 6 2 6 6 2 6 6 2 2 2 4 2 6 5 5 2 2 4 6 6 3 6 1 4 3 3 3 4 6 4 3 2 6 6 6 6 3 4 3 5 1 6 6 5 2 5 2 1 3 1 6 3 4 3 5 6 3 6 6 5 6 4 3 4 1 3 6 4 2 6 5 3 2 6 2 5 5 5 5 5 1 4
The mean of the above data is $\bar{x}=4.02$ and the sample standard deviation is $s=1.6513$.
Use Table B and holt.blue to calculate a $99\%$ confidence interval for the true mean of Sleazy P.'s loaded die.
To calculate our $99\%$ confidence interval, we use $t^{*}=2.632.$
(We round down to $90$ degrees of freedom on Table B. See explanation below.*)
With the above information, we now construct our interval:
$$
\begin{array}{ll}
&\left(\displaystyle \bar{x}-t^{*}\frac{s}{\sqrt{n}}, \bar{x}+t^{*}\frac{s}{\sqrt{n}}\right)\\
=&\left(\displaystyle 4.02-2.632\frac{1.6513}{\sqrt{100}}, 4.02+2.632\frac{1.6513}{\sqrt{100}}\right)\\
=&(3.585,4.455)
\end{array}
$$
From this interval, we are nearly certain that $\mu \neq 3.5,$ that is, that the die was loaded.
*With sample size $n=100$, we have $99$ degrees of freedom. To round up to $100$ in Table B would actually mean that our confidence level is less than $99\%$ since our interval is narrower than a true $99\%$ confidence interval. To round down means that our confidence level is at least $99\%$ since our interval is wider than a true $99\%$ confidence interval.
*With sample size $n=100$, we have $99$ degrees of freedom. To round up to $100$ in Table B would actually mean that our confidence level is less than $99\%$ since our interval is narrower than a true $99\%$ confidence interval. To round down means that our confidence level is at least $99\%$ since our interval is wider than a true $99\%$ confidence interval.
Important Question
Revisiting the Sleazy P. Die Data, was it safe to use the $t$-procedures?
Yes! Since our sample size is substantially larger than $40,$ and our distribution doesn't exhibit any extreme behavior,
we may trust the results.
Bonus Example
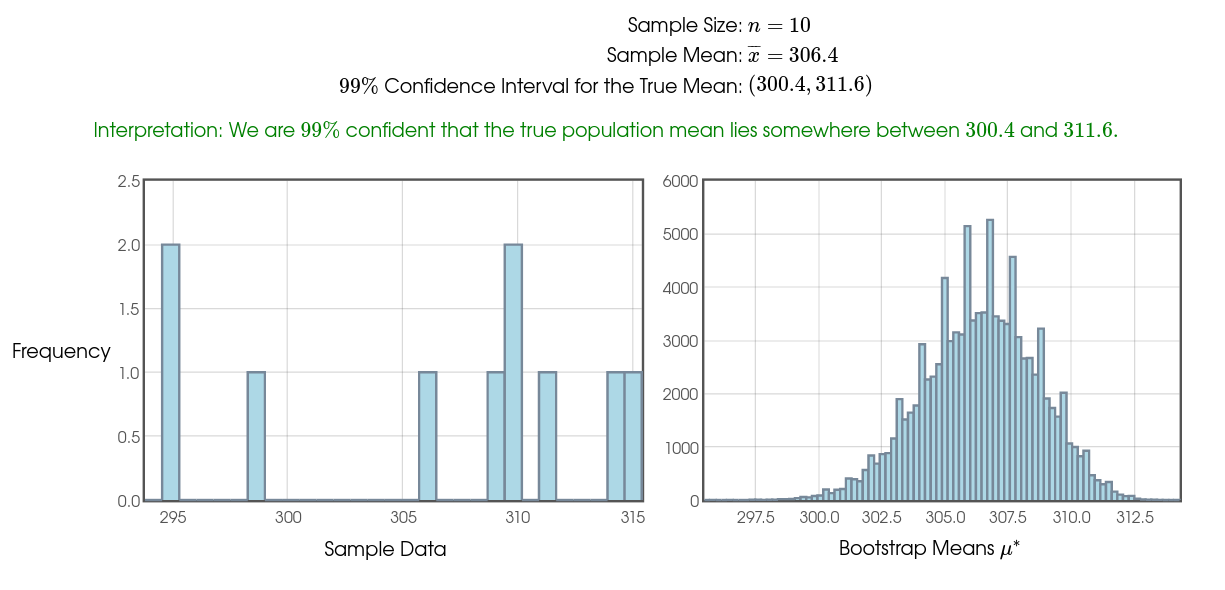
Mr. Holt loves a certain brand of Mango Slices. He notices that the net weight of the product is $284$ grams and is interested to see how close a typical bag comes to this reported net weight. So, over several weeks, he collects the following data in grams: $$ 311, 295, 295, 299, 314, 315, 309, 310, 310, 306 $$ Assuming this is an SRS of bag weights, calculate a $99\%$ confidence interval for the true mean weight of a bag of these slices.


Using software, we calculate a $99\%$ $t$-confidence interval to the nearest tenth of a gram: $(298.7,314.1).$
That is, we are $99\%$ confident that the true mean weight is somewhere between $297.7$ and $314.1$ grams which is considerably higher than $284$ grams.
We conclude that the company which makes this product has set a target mean weight well above the reported mean weight. There are certainly no shenanigans going on here.
Important Question
Revisiting Mr. Holt's Mango-Slice data, was it safe to use the $t$-procedures?
With a small sample size of $10,$ we should definitely proceed with caution.
Looking at the histogram of our data, we see that there don't appear to be any outliers, and the $1.5 \cdot IQR$ rule confirms this.
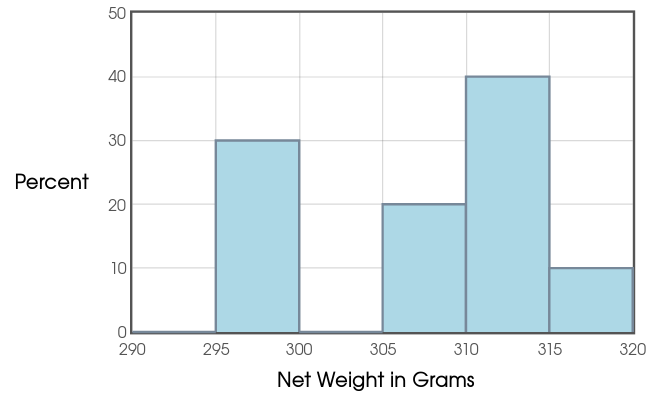 Moreover, we cannot rule out normality. So, especially given that no data values were even close to the reported net weight of $284$ grams, it appears that we are safe.
That said, if we still don't trust the results, we have two options:
Looking at the histogram of our data, we see that there don't appear to be any outliers, and the $1.5 \cdot IQR$ rule confirms this.
That said, if we still don't trust the results, we have two options:
- Collect more delicious data! (Yum!)
- Use alternative, non-parametric methods.
Now we know how to estimate an unknown population mean in a realistic way.
Congratulations!
Historical Side-Note:
The first application of the $t$ distribution was...
(drum roll please!)

Making Better Beer!
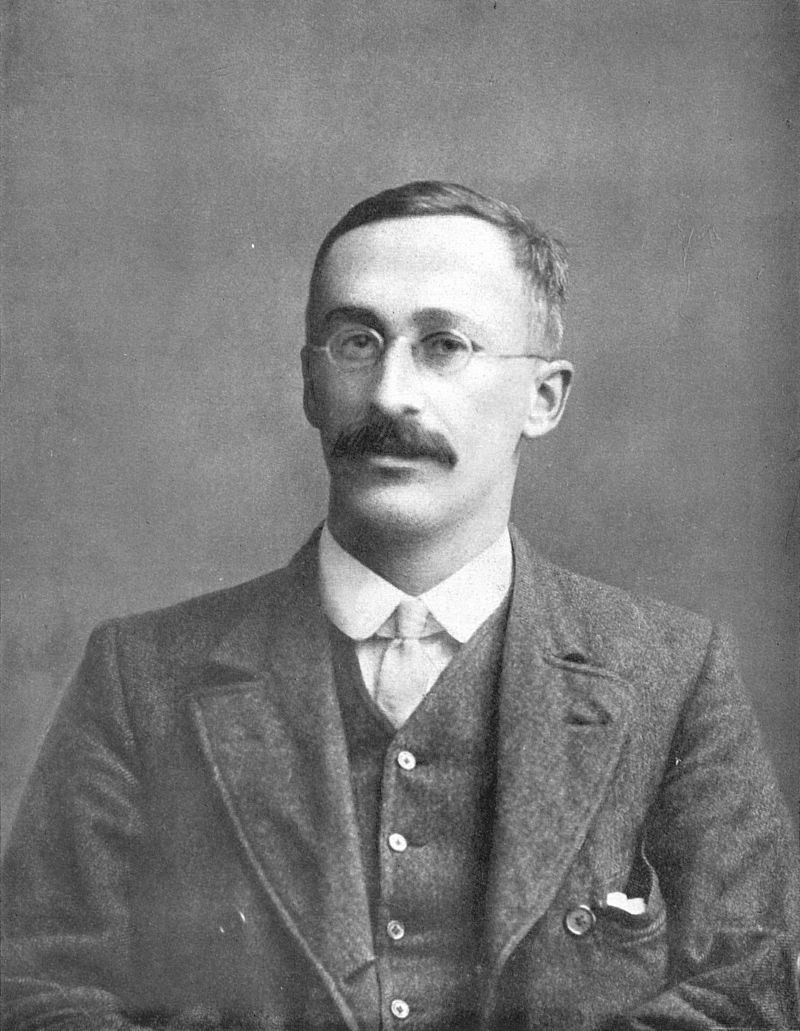
William Sealy Gosset was an English statistician who developed the Student's $t$-distribution while working at the Guinness Brewery in $1908.$