Let's do an experiment.
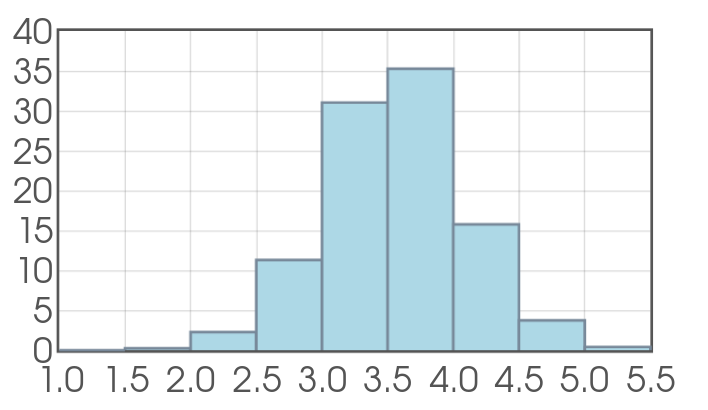
We are going to roll a fair die $10$ times and take the average of the outcomes.
Distribution of Die-Roll Averages
The Central Limit Theorem
Draw an SRS of size $n$ from any population with mean $\mu$ and standard deviation $\sigma.$ The central limit theorem says that when $n$ (the sample size) is large, the sampling distribution of the sample means $\bar{x}$ is approximately normal with distribution with mean $\mu$ and standard deviation $\displaystyle \frac{\sigma}{\sqrt{n}}.$
That is, $$\bar{x} \sim N\left(\mu,\frac{\sigma}{\sqrt{n}}\right).$$
So, for our fair die with $\mu=3.5$ and $\sigma=1.708,$ our "average-of-$10$-rolls" distribution is approximately $$\bar{x}\sim N\left(3.5,\frac{1.708}{\sqrt{10}}\right)=N(3.5,0.54)$$
Question
For $10$ rolls, what is the approximate probability of observing a sample average of $2.5$ or less. That is, what is $P(\bar{x}\leq 2.5)?$
Since our sample averages have the approximate distribution
$$\bar{x} \sim N(3.5,0.54)$$
we may compute the probability
$$
\begin{array}{l}
P(\bar{x} \leq 2.5)\\
=\displaystyle P\left(\frac{\bar{x}-3.5}{0.54} \leq \frac{2.5-3.5}{0.54}\right)\\
=P(z \leq -1.85)\\
=\mbox{Table}(-1.85)\\
=.0322\\
\end{array}
$$
There is about a $3.2\%$ chance of observing a sample average of $2.5$ or less.
An Experiment
Let's suppose the average lifespan of a car battery is $\mu=4$ years.
Life spans of batteries are known to follow an exponential distribution which is very skewed.
We are going to collect data from this population.
Distribution of Average Battery Life
The (Paraphrased) Central Limit Theorem: For any distribution, as the sample size goes up:
1) Histograms of sample averages start to look more and more normal.
2) Sample means become more tightly clustered around the true population mean.
Example: A geyser in Jellystone National Park named "Old Fateful" goes off at regular intervals.
The time between consecutive eruptions $X$ is uniformly distributed between $47$ and $122$ minutes.
Suppose we take a random sample of $n=72$ times between eruptions.
What is the approximate probability that the sample mean $\overline{x}$ will be between $86.377$ minutes and $88.311$ minutes?
Eruptions have a mean pf $\displaystyle \mu=\frac{47+122}{2}=84.5$ and standard deviation
$\displaystyle \sigma=\frac{122-47}{\sqrt{12}}\approx 21.65063509.$
Then our sample means $\bar{x}$ have the approximate distribution $$\bar{x} \sim N\left(84.5,\frac{21.65063509}{\sqrt{72}}\right)\approx N(84.5,2.552)$$ This means that $$ \begin{array}{l} P(86.377 \lt \bar{x} \lt 88.311)\\ =\displaystyle P\left(\frac{86.377-84.5}{2.552} \lt \frac{\bar{x}-84.5}{2.552} \lt \frac{88.311-84.5}{2.552}\right)\\ =P(0.74 \lt z \lt 1.49)\\ =\mbox{Table}(1.49)-\mbox{Table}(0.74)\\ =0.9319-0.7704\\ =0.1615 \end{array} $$
Then our sample means $\bar{x}$ have the approximate distribution $$\bar{x} \sim N\left(84.5,\frac{21.65063509}{\sqrt{72}}\right)\approx N(84.5,2.552)$$ This means that $$ \begin{array}{l} P(86.377 \lt \bar{x} \lt 88.311)\\ =\displaystyle P\left(\frac{86.377-84.5}{2.552} \lt \frac{\bar{x}-84.5}{2.552} \lt \frac{88.311-84.5}{2.552}\right)\\ =P(0.74 \lt z \lt 1.49)\\ =\mbox{Table}(1.49)-\mbox{Table}(0.74)\\ =0.9319-0.7704\\ =0.1615 \end{array} $$
Another Example: Sleazy P. Martini Goes On Trial
Sleazy P. Martini is up to his old tricks again, throwing dice on the wharf and winning lots of bets. You (an observer with statistical knowledge) suspect that Sleazy P. is pulling some shenanigans. That is, you suspect the die he is using is loaded.
You start writing down the result of each roll of Sleazy P.'s die, and record the following data:
5 1 6 5 5 6 4 5 4 3 4 3 5 6 2 3 2 4 6 2 6 6 2 6 6 2 2 2 4 2 6 5 5 2 2 4 6 6 3 6 1 4 3 3 3 4 6 4 3 2 6 6 6 6 3 4 3 5 1 6 6 5 2 5 2 1 3 1 6 3 4 3 5 6 3 6 6 5 6 4 3 4 1 3 6 4 2 6 5 3 2 6 2 5 5 5 5 5 1 4
Sleazy P. Martini Goes On Trial
The sample mean of the above data is $\overline{x}=4.02.$
Assuming the die is fair, what is the probability of seeing a sample mean that is $4.02$ or greater?
Is this probability in any way suggestive?
If Sleazy P. is innocent (that is, he didn't load the die), the mean and the standard deviation of his die
should be $\mu=3.5,$ and $\sigma=1.708.$
Then, our $100$-roll sample means $\bar{x}$ should have the approximate distribution $$\bar{x} \sim N\left(3.5,\frac{1.708}{\sqrt{100}}\right)=N(3.5,0.1708)$$ This means that $$ \begin{array}{l} P(\bar{x} \geq 4.02)\\ =\displaystyle P\left(\frac{\bar{x}-3.5}{0.1708} \geq \frac{4.02-3.5}{0.1708}\right)\\ =P(z \geq 3.04)\\ =1-P(z < 3.04)\\ =1-\mbox{Table}(3.04)\\ =1-.9988\\ =.0012 \end{array} $$
Then, our $100$-roll sample means $\bar{x}$ should have the approximate distribution $$\bar{x} \sim N\left(3.5,\frac{1.708}{\sqrt{100}}\right)=N(3.5,0.1708)$$ This means that $$ \begin{array}{l} P(\bar{x} \geq 4.02)\\ =\displaystyle P\left(\frac{\bar{x}-3.5}{0.1708} \geq \frac{4.02-3.5}{0.1708}\right)\\ =P(z \geq 3.04)\\ =1-P(z < 3.04)\\ =1-\mbox{Table}(3.04)\\ =1-.9988\\ =.0012 \end{array} $$