Today we'll learn techniques which will enable us to compare TWO population means.
A Difference of Two Means
Suppose we are comparing two populations with means $\mu_1$ and $\mu_2$.
Question: If we were all-knowing beings and knew that $\mu_1=\mu_2$, what number would we expect the difference of two sample means $\bar{x}_1-\bar{x}_2$ to be close to?
The Two-Sample $t$ Procedures
Draw two independent SRSs from two normally distributed populations.
The Two-Sample $t$ statistic is $$t=\frac{\bar{x}_1-\bar{x}_2}{\sqrt{\displaystyle \frac{s_1^2}{n_1}+\frac{s_2^2}{n_2}}}$$
The Two-Sample $t$ statistic follows what kind of distribution?
The Two-Sample $t$ Test
To test the hypothesis $H_0: \mu_1=\mu_2$, compute the Two-Sample $t$ test statistic $$t=\frac{\bar{x}_1-\bar{x}_2}{\displaystyle \sqrt{\frac{s_1^2}{n_1}+\frac{s_2^2}{n_2}}}$$
The $p$-value of this test statistic is the degree of evidence against the null hypothesis.
Just One Little Problem
For the Two-Sample $t$, which $t$ distribution do we use?
In other words, how many degrees of freedom do we use?
D:
Two Answers
Option 1: Use software which computes degrees of freedom from a messy formula. $$ df=\frac{\displaystyle \left(\frac{s_1^2}{n_1}+\frac{s_2^2}{n_2}\right)^2}{\displaystyle \frac{1}{n_1-1}\left(\frac{s_1^2}{n_1}\right)^2+\frac{1}{n_2-1}\left(\frac{s_2^2}{n_2}\right)^2} $$
Option 2: Use Table B with $$df=\min\{n_1-1,n_2-1\}$$ knowing that we are only obtaining an upper bound on the true $p$-value.
Please Note: In the homework, the value given by Option 1 will be provided to you.
Test of Significance Comparing an Two Unknown Means
Step 0: Choose your level of significance, $\alpha,$ and check to make sure the techniques you want to use are appropriate. You may do this by plotting your data.
Step 1: State your hypotheses: $H_0: \mu_1=\mu_2$ and $H_a:\begin{array}{c} \mu_1 \neq \mu_2 \\ \mu_1 \gt \mu_2 \\ \mu_1 \lt \mu_2 \end{array}.$
Step 2: Compute the two-sample $t$ test statistic $\displaystyle t=\frac{\bar{x}_1-\bar{x}_2}{\sqrt{\displaystyle \frac{s_1^2}{n_1}+\frac{s_2^2}{n_2}}}.$
Step 3: Determine your $p\mbox{-value}$ by using software or a table.
Step 4: State your conclusion (keep or reject $H_0$). If your $p\mbox{-value}$ falls below the significance level $\alpha,$ then we reject $H_0.$ Otherwise, we keep $H_0$. Also, summarize the conclusion using the language of the problem situation.
Yes, We're Way Overdue for an Example...
Example
Does drinking beer make a person more likely to be bitten by mosquitoes?
A group of researchers studied this question by recruiting willing volunteers. Some of these volunteers drank beer, while the others drank water. The assignment to each group was done randomly.
In a controlled environment, mosquitoes were released and were drawn to the volunteers who were protected by a netting which also trapped the mosquitoes.
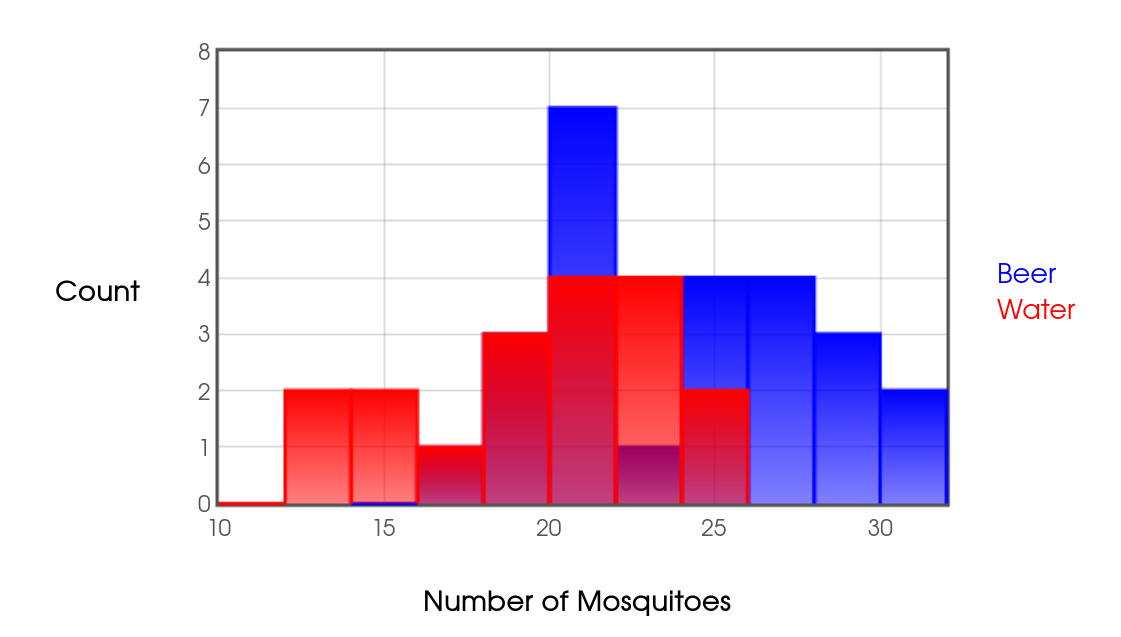
The following $25$ data points are the number of mosquitoes trapped for each individual the beer group: $$ 27, 20, 21, 26, 27, 31, 24, 19, 23, 24, 28, 19, 24, 29, 20, 17, 31, 20, 25, 28, 21, 27, 21, 18, 20 $$ The following $18$ data points are the number of mosquitoes trapped for each individual the water group: $$ 21, 22, 15, 12, 21, 16, 19, 15, 24, 19, 23, 13, 22, 20, 24, 18, 20, 22 $$ Do these data provide evidence that beer drinkers are more attractive to mosquitoes? Carry out a test of significance at the $\alpha=0.05$ level of significance.
If you are using Table B, use $df=39.$
Step #0: For this example $\alpha=0.05$ is our level of significance. Plotting our data,

Step #1: We suspect that mosquitoes are more attracted to beer drinkers, that is, $\mu_B,$ may be higher than the true mean for water drinkers, $\mu_W.$ The null hypothesis says that there is "no difference: the means are the same. On the other hand, the alternative says that "there is a difference: the mean number of mosquitoes attracted to beer drinkers is greater than the the mean number of mosquitoes attracted to water drinkers." These hypotheses are expressed as $$ \begin{array}{c} H_0: \mu_B=\mu_W\\ H_a: \mu_B \gt \mu_W \end{array} $$
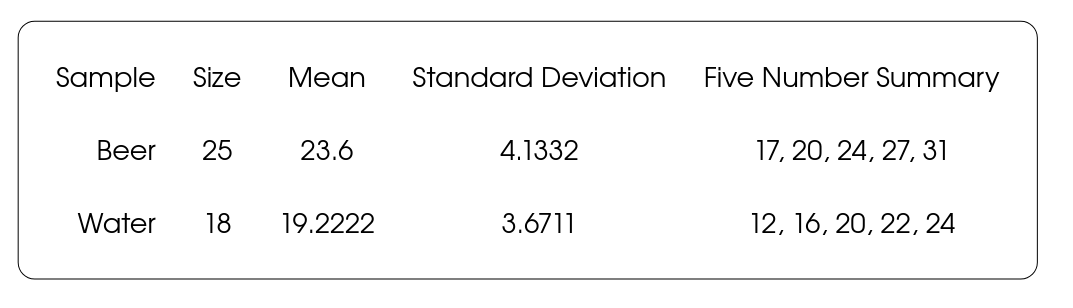
Step #2: Using the sample means and standard deviations computed above, we compute the $t$-statistic: $$ \begin{array}{rl} t&=\displaystyle \frac{\bar{x}_B-\bar{x}_W}{\sqrt{\displaystyle \frac{s_B^2}{n_B}+\frac{s_W^2}{n_W}}}\\ &=\displaystyle \frac{23.6-19.2222}{\sqrt{\displaystyle \frac{4.1332^2}{25}+\frac{3.6711^2}{18}}}\\ &=3.658 \end{array} $$ to three decimal places.
Step #3: We would like to use the Table B for $df=39,$ but we cannot do this since there is no entry for $39.$ So, we must round down to $30.$ This will give us an a slight over estimate of our $p\mbox{-value}.$

$\vdots$

$\vdots$

The above tells us that any $t$-statistic above the value $t^*=1.753$ guarantees a $p$-value less than our level of significance $\alpha=0.05.$
Since $t=3.658\gt 1.753=t^*,$ we know that $p$-value$\,\lt 0.05.$
In fact, the above $t$-statistic and the table tell us that $p$-value$\,\lt 0.001.$
Step #4: Since our $p$-value$\,\lt 0.05=\alpha,$ we reject the null hypothesis $H_0$.
In plain language, there is significant evidence that people who drink beer are more attractive to mosquitoes than people who drink water.
Using software.
Pop Quiz: Who remembers what robust means as a statistical term?
Robustness of the Two-Sample $t$ Procedures
- The two-sample $t$ procedures require that both our samples are independent SRSs taken from both populations. Conclusions are NOT trustworthy if this condition is not met.
- $\mbox{Sample Size Sum}=n_1+n_2 \lt 15$: must be able to assume normal distribution, i.e., symmetric with one peak and no outliers.
- $\mbox{Sample Size Sum}=n_1+n_2\geq 15$: the $t$ procedures can be trusted if there are no outliers and the distribution is not obviously skewed.
- $\mbox{Sample Size Sum}=n_1+n_2\geq 40$ : you may use $t$ procedures even if your distributions appear to be skewed.
- The Two-Sample $t$ procedures are more robust against non-normal data when the sample sizes of both samples are equal. Therefore, when planning a two-sample study, try to choose equal sample sizes.
Example: Mr. Holt owns two cars of the same model but different years: $2008$ and $2013.$
From fill-up to fill-up, he has been recording the gas mileages of each since purchasing both at different times.
For the $2008$ model, Mr. Holt has recorded $75$ fill ups:
31.9, 33.8, 35.1, 30.9, 32.9, 30.2, 30.6, 32.9, 32.0, 34.9, 29.3, 31.1, 29.8, 30.9, 32.8, 31.9, 30.7, 31.8, 32.8, 30.7, 32.5, 28.8, 32.2, 31.8, 29.8, 26.7, 28.3, 28.4, 28.7, 26.0, 31.2, 28.5, 27.7, 29.4, 30.9, 25.7, 23.7, 25.1, 32.7, 27.2, 36.8, 30.2, 32.7, 27.8, 24.3, 29.8, 30.4, 22.7, 22.3, 28.8, 30.2, 23.4, 34.1, 32.3, 24.4, 31.7, 38.8, 23.5, 32.1, 32.3, 33.0, 27.4, 32.1, 31.2, 32.9, 28.8, 34.9, 30.8, 32.7, 30.8, 33.2, 32.2, 29.9, 30.9, 27.7
For the $2013$ model, he has recorded $24$ fill ups:
34.5, 37.8, 34.0, 44.8, 31.8, 40.3, 44.2, 42.8, 39.8, 34.0, 20.9, 36.9, 41.8, 38.8, 34.6, 27.7, 23.0, 38.1, 33.4, 23.3, 42.7, 37.8, 34.2, 42.6
Question: Does Mr. Holt have evidence that the average gas mileage of both cars is different? Carry out a test of significance at the $\alpha=0.01$ level of significance.
If you are using Table B, use $df=26.$
Step #0: For this example $\alpha=0.01$ is our level of significance. Plotting our data,
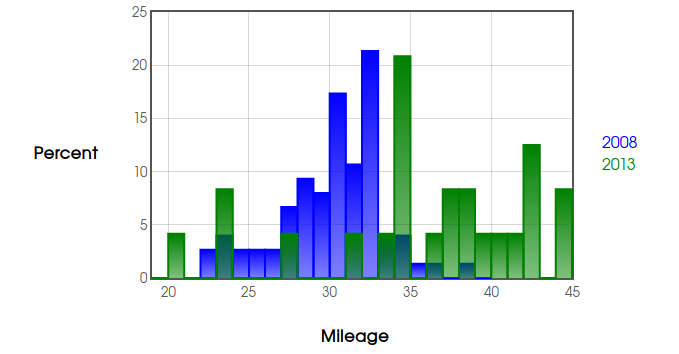
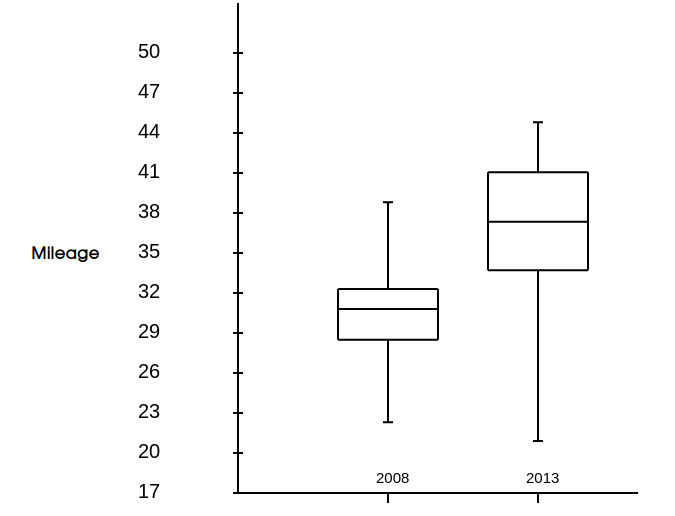
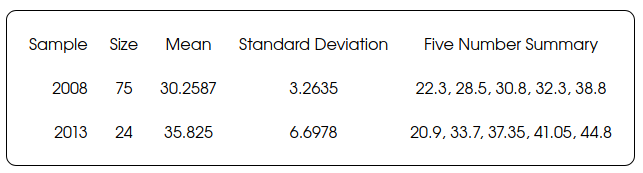
Although the distribution for the mileages of the $2013$ model look like they might be negatively skewed and both groups contain outliers, the sum of our sample sizes, $n_{2008}+n_{2013}=75+24=99$ is large enough (greater than $40$) so that the $t$-procedures are still reliable.
Step #1: We suspect that the true mean gas mileage of the $2008$ model, $\mu_{2008},$ may be different than true mean gas mileage for the $2013$ model, $\mu_{2013}.$ The null hypothesis says that there is "no difference: the means are the same." On the other hand, the alternative says that "there is a difference: the mean gas mileages of both vehicles are NOT the same." These hypotheses are expressed as $$ \begin{array}{c} H_0: \mu_{2008}=\mu_{2013}\\ H_a: \mu_{2008} \neq \mu_{2013} \end{array} $$
Step #2: Using the sample means and standard deviations computed above, we compute the $t$-statistic: $$ \begin{array}{rl} t&=\displaystyle \frac{\bar{x}_{2008}-\bar{x}_{2013}}{\sqrt{\displaystyle \frac{s_{2008}^2}{n_{2008}}+\frac{s_{2013}^2}{n_{2013}}}}\\ &=\displaystyle \frac{30.2587-35.825}{\sqrt{\displaystyle \frac{3.2635^2}{75}+\frac{6.6978^2}{24}}}\\ &=-3.925 \end{array} $$ to three decimal places.
Step #3: Using Table B, we take $df=26.$
$\vdots$

$\vdots$
The above tells us that any $t$-statistic either below the value $t^*=-2.779$ above the value $t^*=2.779$ guarantees a $p$-value less than our level of significance $\alpha=0.01.$
Since $t=-3.925\lt -2.779=t^*,$ we know that $p$-value$\, \lt 0.01.$
Step #4: Since our $p$-value$\, \lt 0.01= \alpha,$ we reject the null hypothesis $H_0$.
In plain language, there is significant evidence that the gas mileages are different. In particular, the $2013$ model gets better gas mileage than the $2008$ model on average.
Some Cautions when Using Tests of Significance
- Levels of significance are only a guide in reaching evidence-based conclusions. A common level of significance is $\alpha=0.05,$ but when evaluating a study, the $p\mbox{-value}$ itself is the best for making an informed decision about whether an effect is present.
- Statistical significance does not tell us whether an effect is large enough to be important. That is, statistical significance and practical significance are entirely different things.
- Double Jeopardy. Running a single test of significance and rejecting $H_0$ is evidence that you have detected an effect. On the other hand, repeating a test until you reject $H_0$ is by no means considered evidence against the $H_0.$ In fact, this is exceedingly poor practice. What type of error would this be?

...and one more thing.
Keeping the null hypothesis doesn't mean that it's true. It only means your sample doesn't provide enough evidence against $H_0.$
An effect might not be easily detected with a small sample size.
What type of error is this?
Is Squaresville Smarter than Quad Town?
The true mean IQ of Squaresville is $\mu_1=$, and the true mean IQ of Quad Town
is $\mu_2=$.
Independently sample citizens from Squaresville
and citizens from Quad Town.
True IQ difference: $\mu_1-\mu_2=$ with $\alpha=$.
$$
P(\mbox{Type I Error})=P(\mbox{Reject $H_0$}|\mbox{$H_0$ is true})=\alpha\,\,\,\,\,\,\,\mbox{Power}=P(\mbox{Reject $H_0$}|\mbox{$H_a$ is true})
$$
| Squaresville | Quad Town | |