
How to Use Fifty States Fifty Stats
 Fifty States Fifty Stats allows you to compare a veritable variety state statistics for all 50 states!
You may choose both the horizontal vertical state stats in any combination you like
by using the drop down menus.
Fifty States Fifty Stats allows you to compare a veritable variety state statistics for all 50 states!
You may choose both the horizontal vertical state stats in any combination you like
by using the drop down menus.
Each plot has 50 points, with each point representing an individual state. To find out which state the point represents, you may hover your mouse arrow over the point to reveal the state, as well as the value of both the horizontal and vertical statistics as seen below.
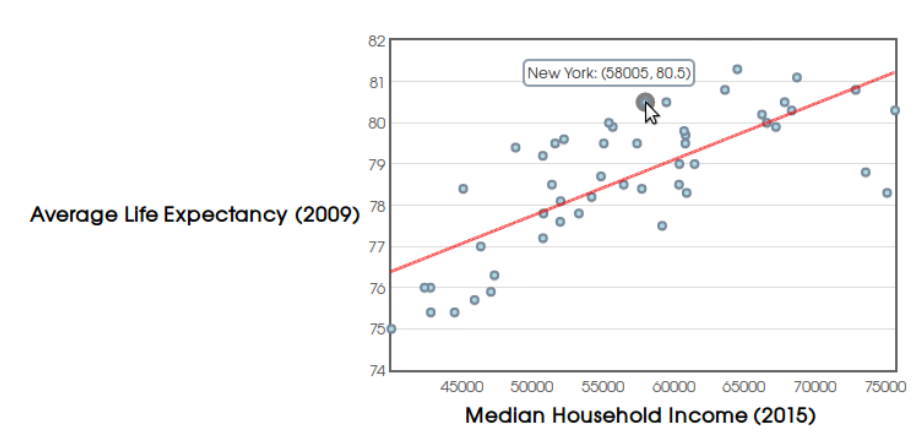
There is also a button which will automatically plot two random state statistics for you.
The output includes a brief verbal summary of how strong the relationship is: Very Weak, Weak, Moderate, Strong, and Very Strong. For the more statistically inclined, the ouput also includes the regression line, the correlation, and the R-squared value.
More About Fifty States Fifty Stats
Fifty States Fifty Stats has gathered publicly available statistics about all fifty states. These statistics come from government agencies, as well as non-profit entities whose data is publicly available. We make no claims about the reliability of this data, and any conclusions you can draw from this data are as good as the sources and the techniques they used to collect their data. That being said, Fifty States Fifty Stats is not intended for drawing any conclusions (see the cautionary note below). Rather, it is meant to stoke the fires of curiosity about country we live in and the world as a whole.We believe that data tell a story, and that even the most basic analysis (looking a graphical summaries of data) helps us understand the story the data are trying tell. Also, we think that looking at data can also be a lot of fun; try a few combinations on your own, and see if you can guess whether or not two variables are associated.
Some Cautions About Correlation
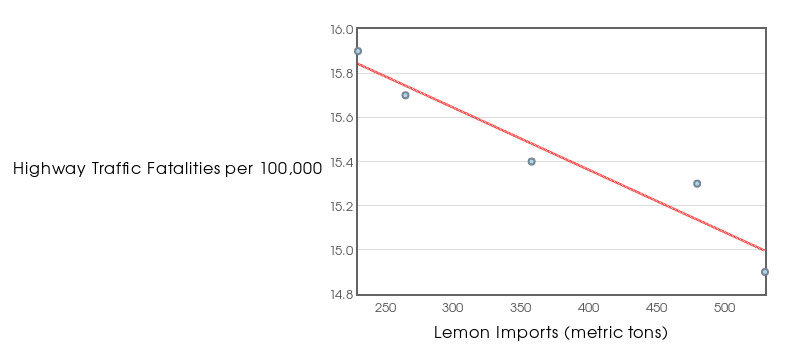
Please be advised that correlated variables do not mean that there is a cause and effect relationship. As the old saying goes: correlation does not imply causation.The following is a great example: from the year 1996 to 2000, lemon imports from Mexico were strongly correlated to traffic fatalities in the United States. As more lemons were imported from Mexico, the lower traffic fatalities in the U.S.. These data and their regression line are graphed below.
Please keep the above firmly in mind when using for this site. When you do observe that two variables are correlated, please remember that there is very likely some other explanation for the association other than cause and effect. So if you see something on this site which either seems to support, or not support, your world view (and most assuredly you will find both), please take it with a healthy grain of salt; more advanced methods are required to make cause and effect conclusions.
There are other considerations (how unusually large or small values affect the analysis, if are assumptions met for the analysis we want to do, etc.) which a real and thorough analysis must consider, but alas, we will not talk about them here. To learn more about how to really do statistics, we recommend taking a bona fide statistics course.