This website offers dynamic readability tools. That is, in addition to giving you a readability score for
your entire text, our tools allow you to
measure how readability changes as you progress through the text.
This allows you to track how consistently your text is written.
(If you aren't familiar with what a readability index is and what it measures,
we invite you to read our discussion of the topic
here.)
We shall present an example which illustrates how to interpret the results for your own texts.
For the purposes of illustration we analyzed a "Frankentext" which progresses from notoriously easy to
notoriously difficult. The text consists of, in the following order,
Dr. Seuss' "Green Eggs and Ham," Chapter 19 of John Steinbeck's "The Grapes of Wrath," and Federalist Paper No. 10.
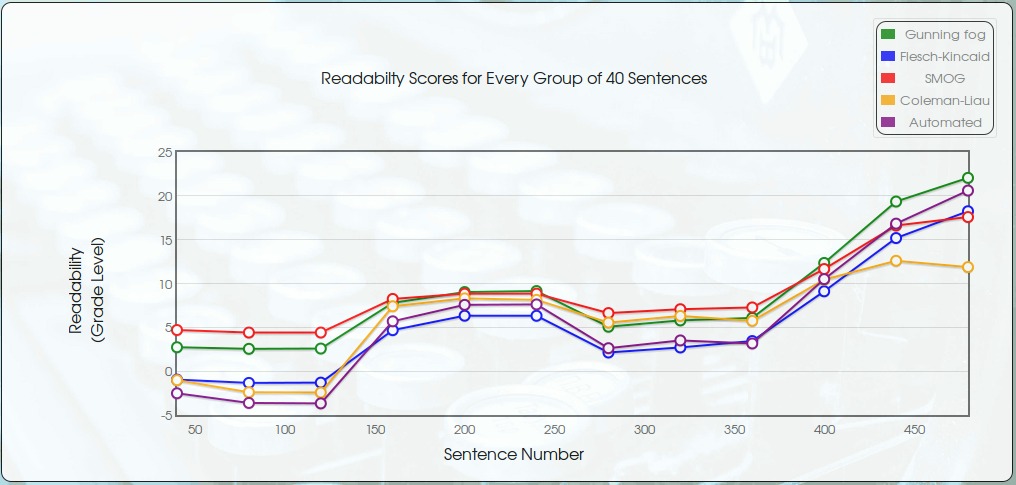
See the image below of the graph which tracks the readability according to five common indices
of our Frankentext in groups of 40 sentences. It is plainly visible that the readability progresses
from easier to more difficult. Can you determine where each of the above mentioned texts lie on the graph?
If so, then you know how to interpret this particular graphic.
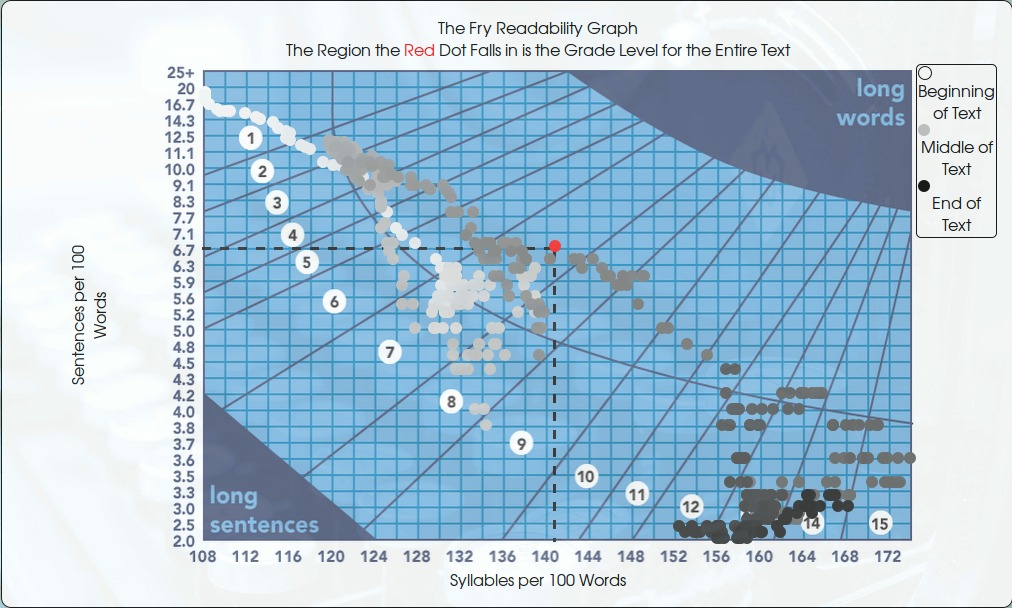
Let's now discuss the dynamic Fry readability graph which is given below.
This one is a little more difficult, but once explained, will hopefully make a little more sense.
If you're unfamiliar with the Fry Readability Formula, you may go
here before proceeding.
Also, this site includes a dynamic version of the
The Raygor Readability Estimate
which is very similar to the Fry graph.
Each grayscale dot represents the Fry Readability Score of a 500 word sample of our Frankentext.
The color of each dot represents how far along in the text we are.
White represents the very beginning of a text (first 500 words) progressing ever darker to
black which represents the end of the text (last 500 words).
It should be plainly visible that "Green Eggs and Ham" at the beginning is represented by lighter colored dots
and that Federalist Paper No. 10 toward the end is represented by darker colored dots.
Moreover, we can see how the Fry Readability Score progresses from 1st grade level to
3rd year undergraduate level and beyond.
Finally, the red dot is the "average" Fry Readability Score for the entire text.
The above tools give us an objective, yet visual measure of not only the readability of a text,
but also how consistently it is written.
As the previous graph shows, the Fry Readability Score of the entire Frankentext
is rated at 7th grade, but, of course, this is like saying that "someone with their head in the oven and
their feet in the freezer is on the average quite comfortable!"
The inconsistency in grade level using the above analysis becomes obvious.
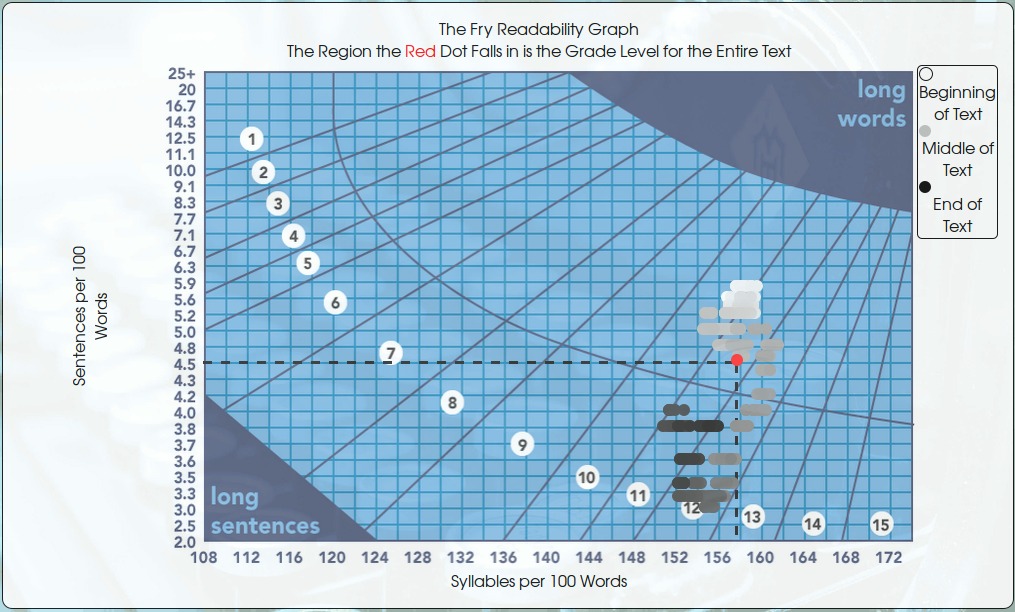
For contrast, we present the same analysis of a consistent, focused, well-written New York Times opinion piece:
Semicolons: A Love Story, by Ben Dolnick.
As we can literally see, the latter is clearly more consistent than the former with the measured level
ranging from around 10th to 12th grade level with the entire text being rated at 11th grade (red dot).
Thus, if you're looking to measure the readability as well as the consistency of your writing,
our dynamic readability tools may very well help you.


