By using derivatives, we can get an incredibly detailed picture (literally!) of the behavior of a function.
Recall: MVT Corollary #3
Let $f$ be continuous over the closed interval $[a,b]$ and differentiable over the open interval $(a,b).$
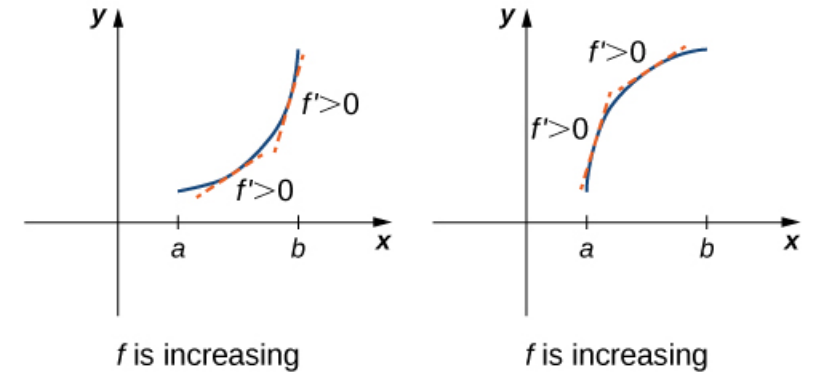
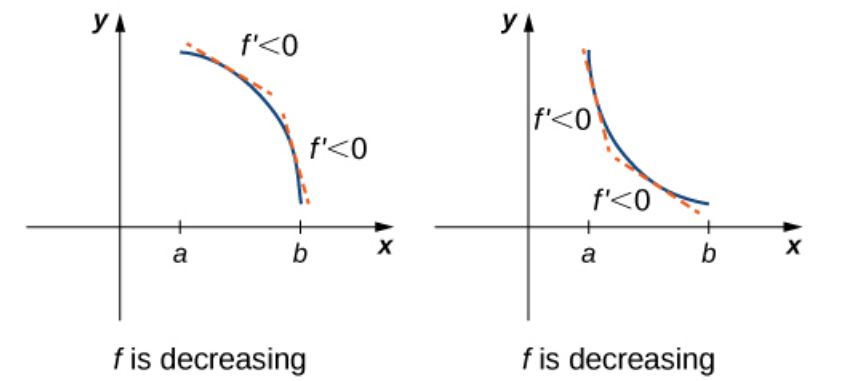
i. If $f'(x) \gt 0$ for all $x\in (a,b),$ then $f$ is an increasing function over $[a,b].$
First Derivative Test
Suppose that $f$ is a continuous function over an interval $I$ containing a critical point $c.$ If $f$ is differentiable over $I,$ except possibly at point $c,$ then $f(c)$ satisfies one of the following descriptions:
i.If $f'$ changes sign from positive when $x \lt c$ to negative when $x \gt c,$ then $f(c)$ is a local maximum of $f.$
ii.If $f'$ changes sign from negative when $x \lt c$ to positive when $x \gt c,$ then $f(c)$ is a local minimum of $f.$
iii.If $f'$ has the same sign for $x \lt c$ and $x \gt c,$ then $f(c)$ is neither a local maximum nor a local minimum of $f.$
Example
Use the first derivative test to locate all local extrema for $f(x)= \displaystyle \frac{5}{3}x^3- 10x^2+15x-1.$
Pro-Tip: Use a sign diagram to keep track of the sign of $f'(x).$
We first find the derivative $f'(x)$ and make a sign diagram:
$$
\begin{array}{ll}
f'(x)&=5x^2-20x+15\\
&=5(x^2-4x+3)\\
&=5(x-1)(x-3).
\end{array}
$$
Thus, the derivative is $0$ when $x=1$ and $x=3.$ We may now make a sign diagram:

Since the derivative changes from positive to negative at $x=1,$ we have by the First Derivative Test that this point is a relative maximum.
Similarly, since the derivative changes from negative to positive at $x=3,$ the First Derivative Test tells us that this point is a relative minimum.

Since the derivative changes from positive to negative at $x=1,$ we have by the First Derivative Test that this point is a relative maximum.
Similarly, since the derivative changes from negative to positive at $x=3,$ the First Derivative Test tells us that this point is a relative minimum.
Concavity of a Graph
Let $f$ be a function that is differentiable over an open interval $I.$
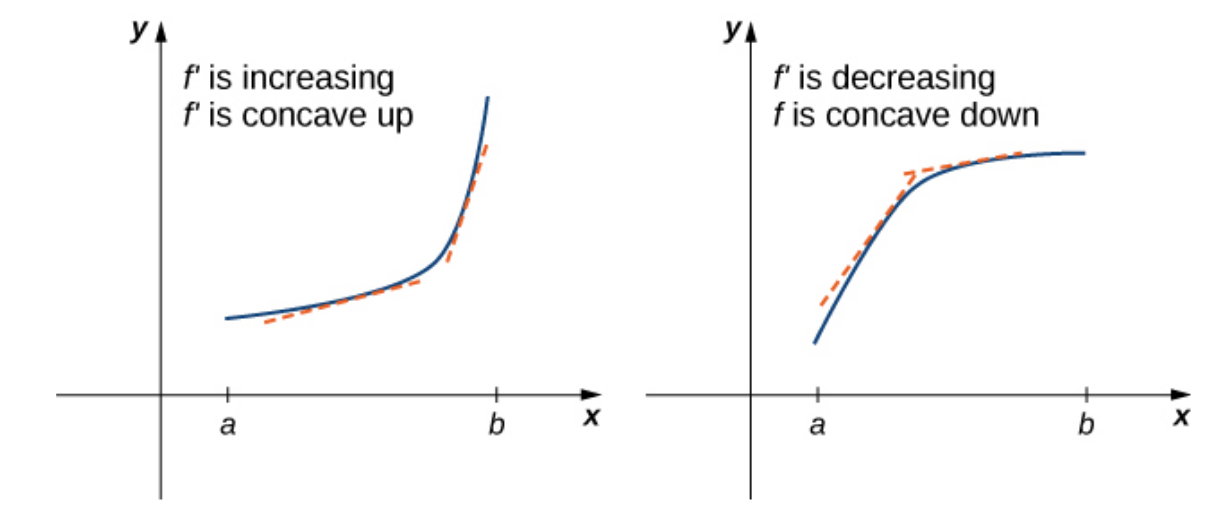
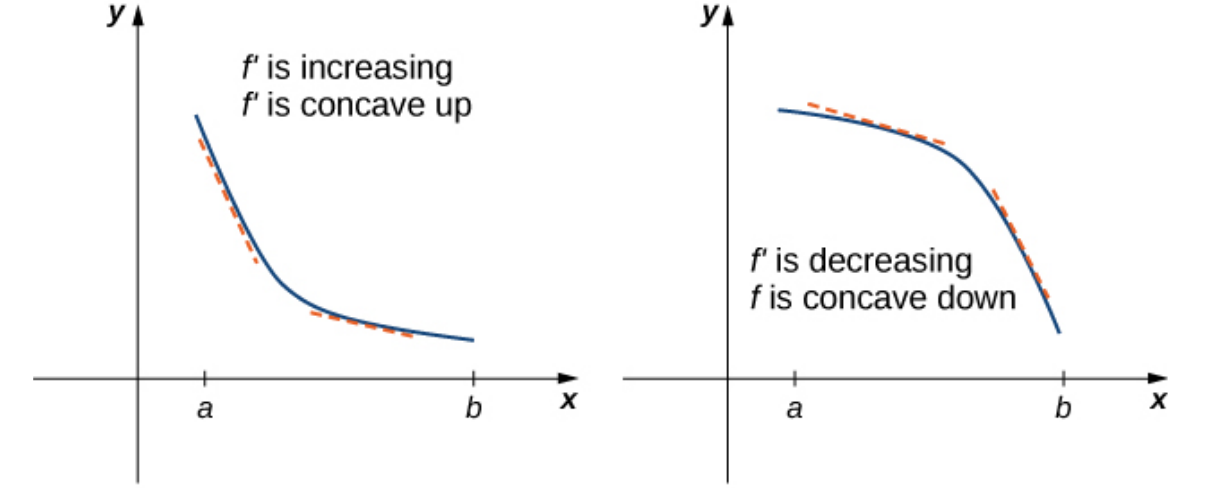
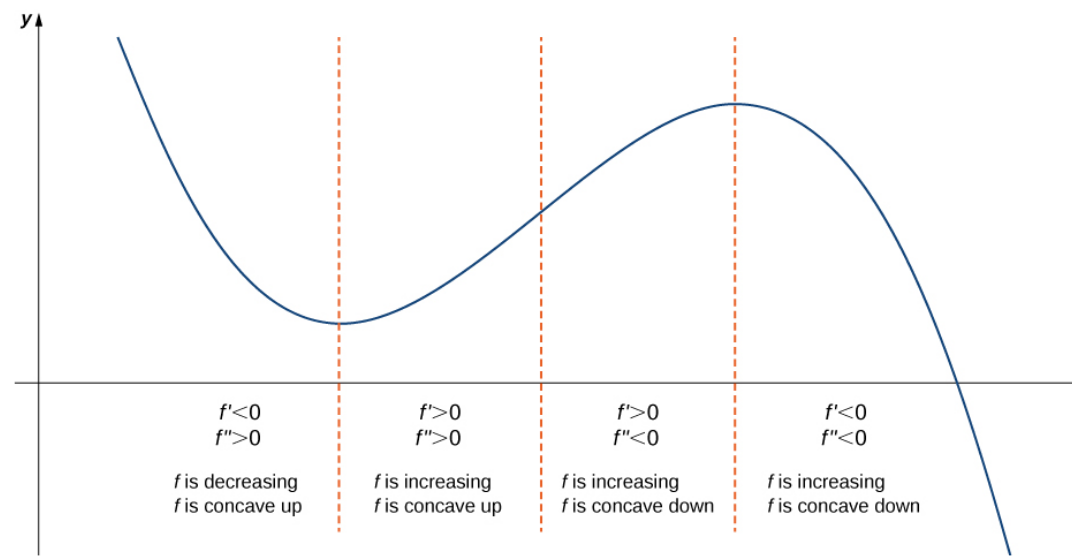
If $f'$ is increasing over $I,$ we say $f$ is concave up over $I.$
Something to Notice
If $f'(x)$ is increasing, then $f''(x) \gt 0.$
If $f'(x)$ is decreasing, then $f''(x) \lt 0.$
This fact gives us...
Concavity and the Second Derivative
Let $f$ be a function that is twice differentiable over an interval $I.$
i.If $f''(x) \gt 0$ for all $x \in I,$ then $f$ is concave up over $I.$
ii.If $f''(x) \lt 0$ for all $x \in I,$ then $f$ is concave down over $I.$
First and Second Derivatives and the Shape of a Graph
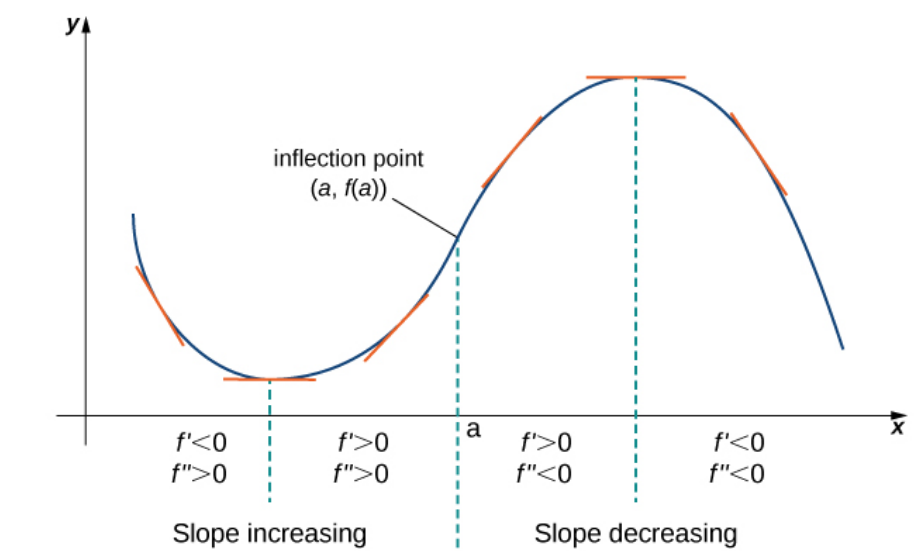
Inflection Points
If $f$ is continuous at $a$ and $f$ changes concavity at $a,$ the point $(a,f(a))$ is an inflection point of $f.$
Example
For the function $f(x)=\displaystyle \frac{5}{3}x^3- 10x^2+15x-1,$ find all intervals where $f$ is concave up and all intervals where $f$ is concave down. Use your sign diagram for $f'(x)$ from the previous example and a sign diagram of $f''(x)$ to sketch a graph of $f(x).$ Confirm your result by using a graphing utility.
We find the second derivative $f''(x)$ and make a sign diagram:
$$
\begin{array}{ll}
f''(x)&=10x-20\\
&=10(x-2)\\
\end{array}
$$
Thus, the second derivative is $0$ when $x=2.$ We may now make a sign diagram:

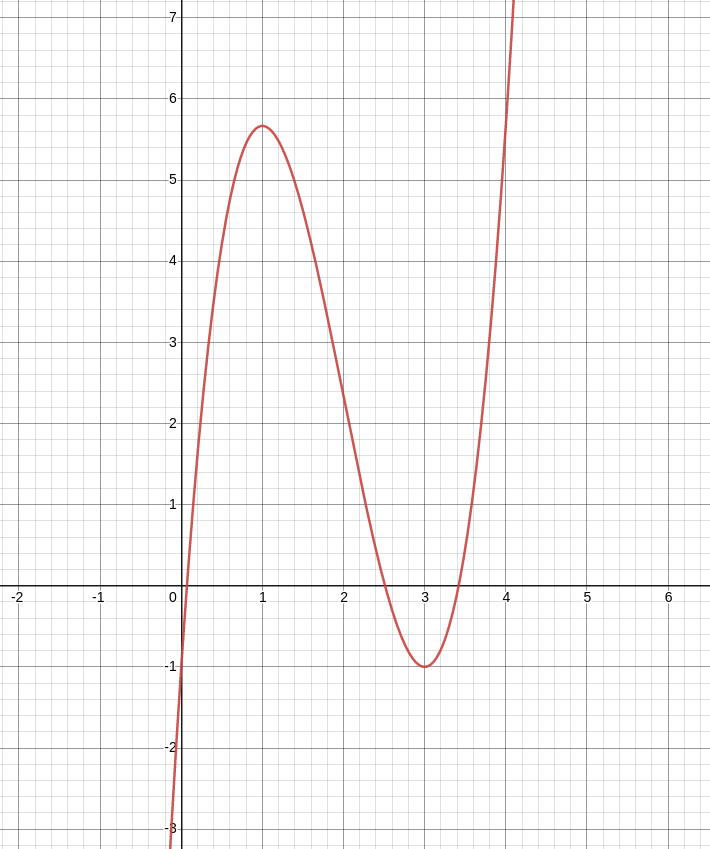
We see then that the second derivative is concave down on $(-\infty,2)$ and is concave up on $(2,\infty).$ Thus, $x=2$ is an inflection point.
Before sketching our graph, we will find the $y$-coordinates of the minimum, maximum, and inflection points: $$ \begin{array}{ll} \mbox{Local Max:} & f(1)=\displaystyle \frac{5}{3}\cdot 1^3- 10 \cdot 1^2+15\cdot 1-1=5.\overline{6}\\ \mbox{Inflection:} & f(2)=\displaystyle \frac{5}{3}\cdot 2^3- 10 \cdot 2^2+15\cdot 2-1=2.\overline{3}\\ \mbox{Local Min:} & f(3)=\displaystyle \frac{5}{3}\cdot 3^3- 10 \cdot 3^2+15\cdot 3-1=-1\\ \end{array} $$ Thus, $(1,5.\overline{6})$ is a local max, $(2,2.\overline{3})$ is an inflection point, and $(3,-1)$ is a local minimum.
We also note that the $y$-intercept point is $(0,-1).$
Recalling our sign diagrams for the first derivative:


We now have everything we need to sketch a nice graph of $f(x):$

Checking with our graphing utility:

We see then that the second derivative is concave down on $(-\infty,2)$ and is concave up on $(2,\infty).$ Thus, $x=2$ is an inflection point.
Before sketching our graph, we will find the $y$-coordinates of the minimum, maximum, and inflection points: $$ \begin{array}{ll} \mbox{Local Max:} & f(1)=\displaystyle \frac{5}{3}\cdot 1^3- 10 \cdot 1^2+15\cdot 1-1=5.\overline{6}\\ \mbox{Inflection:} & f(2)=\displaystyle \frac{5}{3}\cdot 2^3- 10 \cdot 2^2+15\cdot 2-1=2.\overline{3}\\ \mbox{Local Min:} & f(3)=\displaystyle \frac{5}{3}\cdot 3^3- 10 \cdot 3^2+15\cdot 3-1=-1\\ \end{array} $$ Thus, $(1,5.\overline{6})$ is a local max, $(2,2.\overline{3})$ is an inflection point, and $(3,-1)$ is a local minimum.
We also note that the $y$-intercept point is $(0,-1).$
Recalling our sign diagrams for the first derivative:


We now have everything we need to sketch a nice graph of $f(x):$

Checking with our graphing utility:

Summary of What Derivatives Tell Us about Graphs
The Second Derivative Test
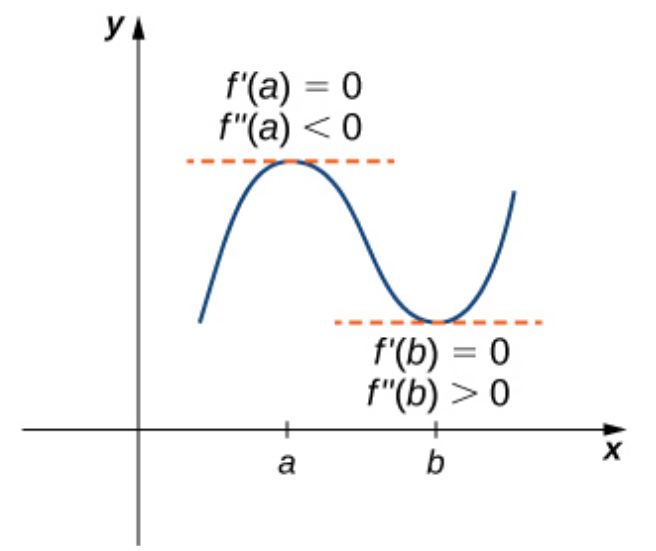
Suppose $f'(c)= 0 ,$ $f''$ is continuous over an interval containing $c.$
i. If $f''(c)> 0,$ then $f$ has a local minimum at $c.$
ii. If $f''(c)< 0,$ then $f$ has a local maximum at $c.$
iii. If $f''(c)= 0,$ then the test is inconclusive.
Example
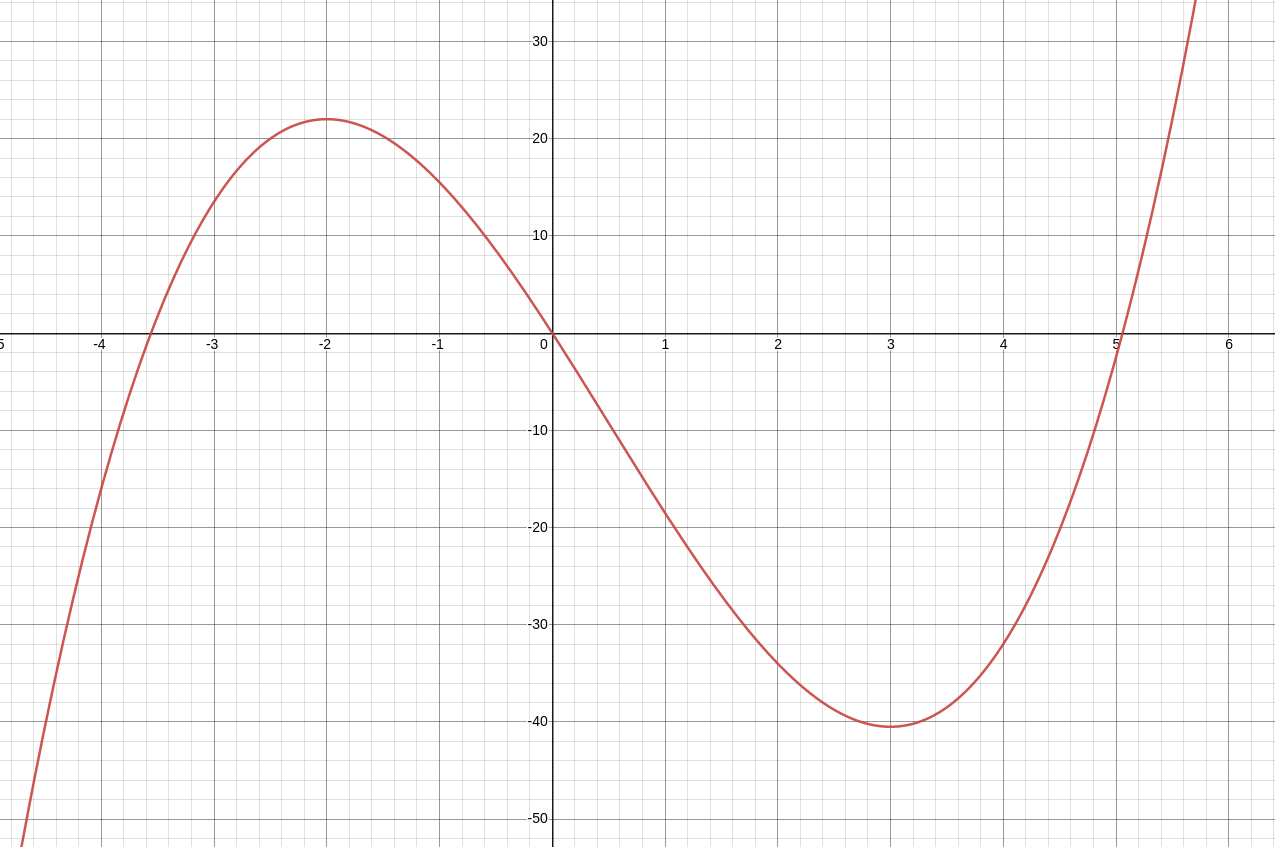
Consider the function $\displaystyle f(x)=x^3-\frac{3}{2}x^2- 18x.$
The points $x= -2,$ $x=3$ satisfy $f'(x)= 0.$
Use the second derivative test to determine whether $f$ has a local maximum or local minimum at those points.
Use a graphing utility to confirm your results.
We shall look at the sign of the second derivative at $x= -2$ and $x=3.$
First we compute $f''(x).$ We see that $f'(x)=3x^2-3x-18,$ so that $f''(x)=6x-3.$
Thus, by the Second Derivative Test, $$ \begin{array}{lll} x=-2 & f''(-2)=6(-2)-3=-15 \lt 0 &\implies \mbox{maximum}\\\\ x=3 & f''(3)=6 (3)-3=15 \gt 0& \implies \mbox{minimum}\\ \end{array} $$
We now verify the above with a graphing utility:
