Today we learn about one of the most used distributions in all of probability and statistics: the Normal Distribution.
The full truth of this statement will become clearer in subsequent sections.
Some Places You Might See Normal Distributions
Biology: sizes, heights, weights within a species (from trees to humans). Blood pressure in human adults.
Manufacturing: sizes and weights of mass produced items (diameter sizes of ball bearings, the amount of liquid in a can of soda, the weight of a package of oreos). Measurement errors in all of the above.
Social Sciences: Test scores (IQ, ACT/SAT).
Various: Yearly precipitation in certain parts of the world, the position of a particle that experiences diffusion.
This is all to say that normal distributions are EVERYWHERE!
Moreover, an understanding of normal distributions is at the foundation of the inferential statistical procedures we will be learning as the culmination of this course.
This is all to say that normal distributions are IMPORTANT!
Normal Distribution Basics: The normal distribution is a symmetric, bell-shaped distribution.
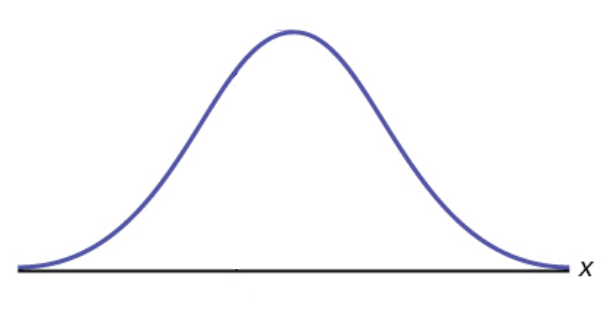
Normal Distribution Basics
Every normal distribution is determined by two numbers: the mean $\mu$, and the standard deviation $\sigma$.
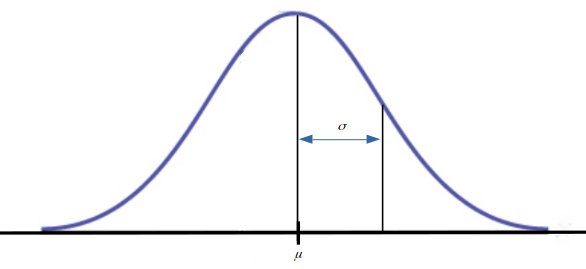
$\mu$ tells us where the center of our distribution is.
$\sigma$ tells us how wide, or "spread out," the distribution is.
Normal Distribution Basics: Examples of Normal Distributions
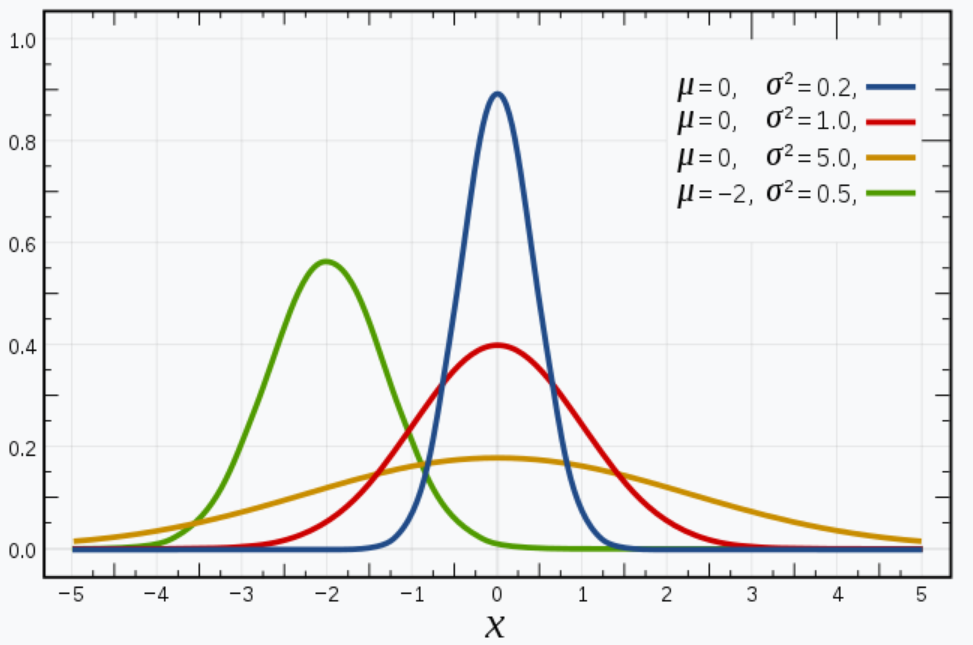
A normal distribution with mean $\mu$ and standard deviation $\sigma$ is denoted as $$N(\mu,\sigma).$$
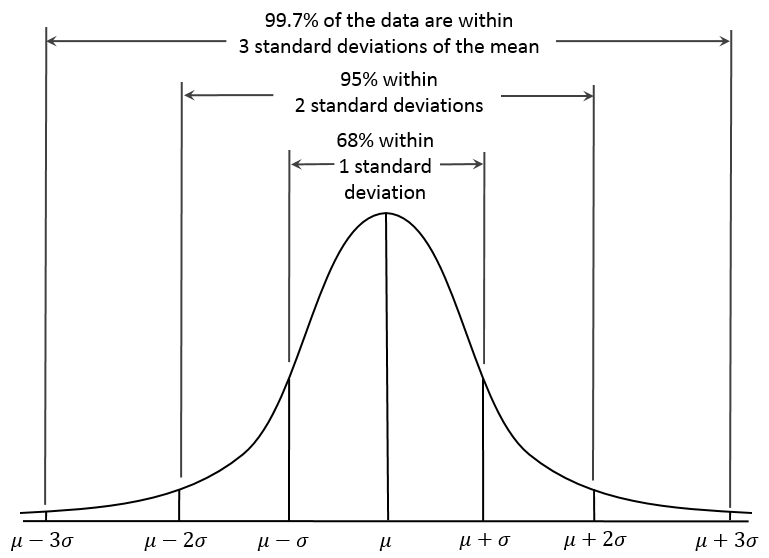
Normal Distribution Basics: The $68\mbox{-}95\mbox{-}99.7$ Rule
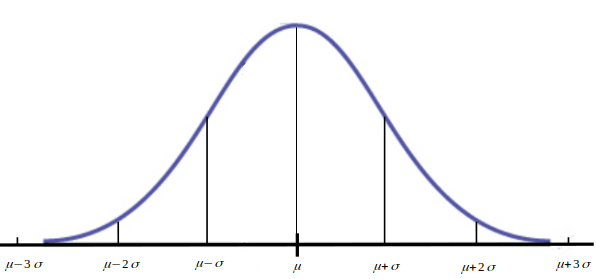
About $68\%$ of observations lie within $1$ standard deviation of the mean.
About $95\%$ of observations lie within $2$ standard deviations of the mean.
About $99.7\%$ of observations lie within $3$ standard deviations of the mean.
Normal Distribution Basics: The $68\mbox{-}95\mbox{-}99.7$ Rule
Stop Taking Notes Right Now!
Normal Distribution "Basics"

PDF: $\displaystyle f(x)=\frac{1}{\sigma \sqrt{2\pi}}e^{-\frac{(x-\mu)^2}{2 \sigma^2}}$
Note: You DO NOT need to memorize this!
Normal Distribution "Basics"
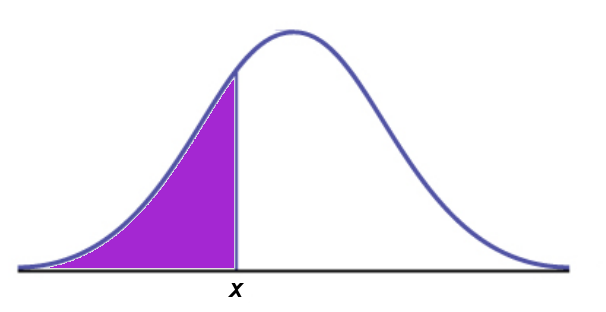
CDF: $\displaystyle F(x)=\mbox{This is Where we Start Using a Table}$
You may start taking notes again.

Example: Iowa Test Scores. The Iowa Assessments are standardized tests provided as a service to schools by of the University of Iowa.
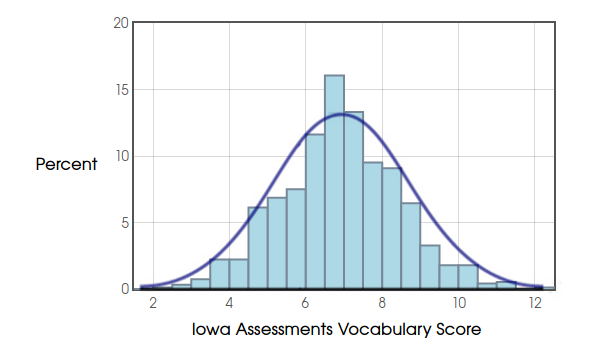
Example: Iowa Test Scores.

Example: Iowa Test Scores & The $68\mbox{-}95\mbox{-}99.7$ Rule
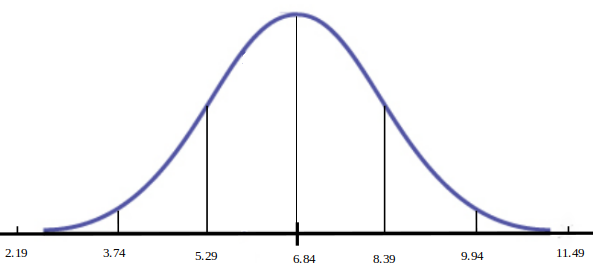
Example: Iowa Test Scores
Who recalls what would be a handy thing to have at this moment?
For a normal distribution $N(\mu, \sigma),$ use the following guide to find $F(x)$:
- Compute the value $z=\displaystyle \frac{x-\mu}{\sigma}$.
- Find the value of $z$ in this table.
- The number corresponding to this value of $z$ is $F(x).$
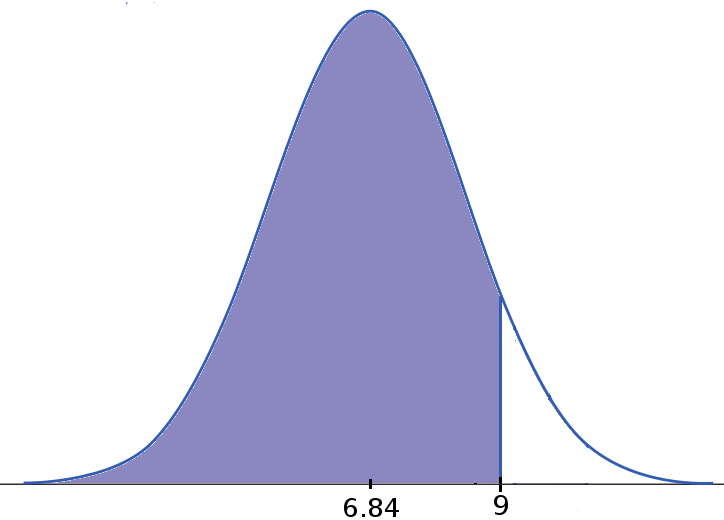
Example: Iowa Test Scores. To find $P(X<9)=F(9)...$
 | $\displaystyle \longrightarrow$ | 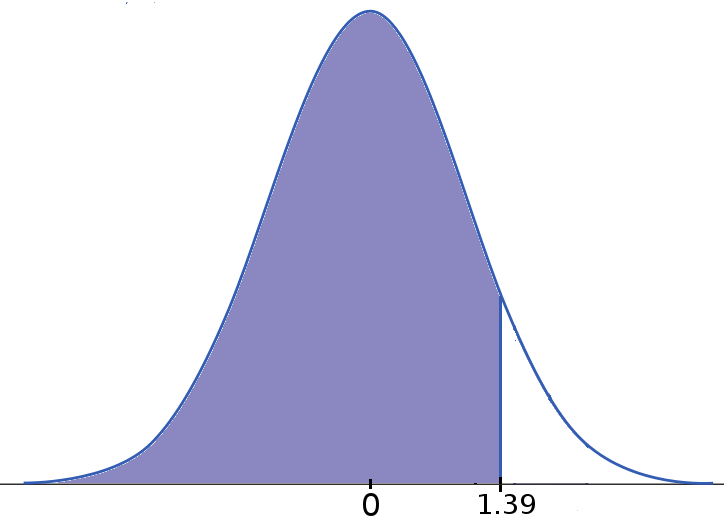 |
| Original: $N(6.84,1.55)$ | Standard Normal $N(0,1)$ |
Example: Iowa Test Scores.
 | $\displaystyle \longrightarrow$ |  |
| Original: $N(6.84,1.55)$ | Standard Normal $N(0,1)$ |
Thus, $91.77\%$ of students scored below $9$ on the Iowa Vocabulary Test.
Put another way, the probability that a randomly chosen student scores $9$ or below is $0.9177.$
Example: Iowa Test Scores
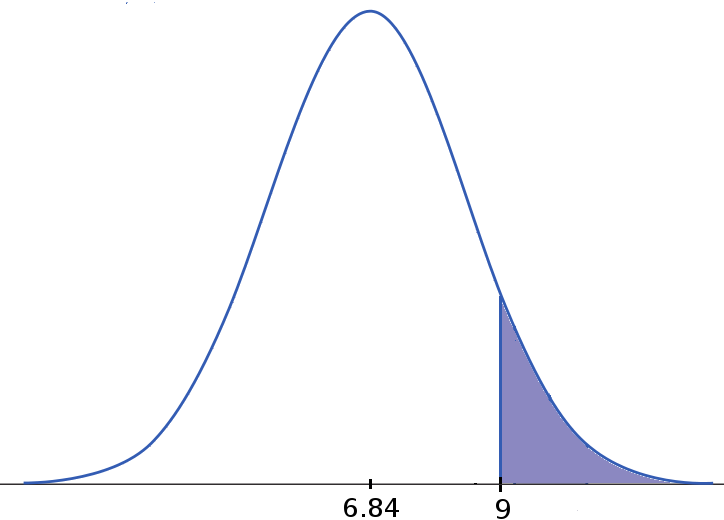
$P(X>9)=1-P(X<9) \approx 1-0.9177 = 0.0823$
Example: Iowa Test Scores
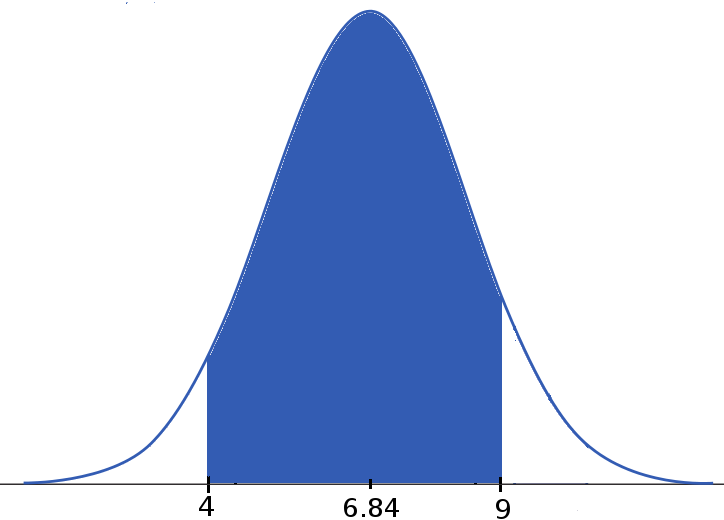
Example: Iowa Test Scores.
 | $\displaystyle \longrightarrow$ | 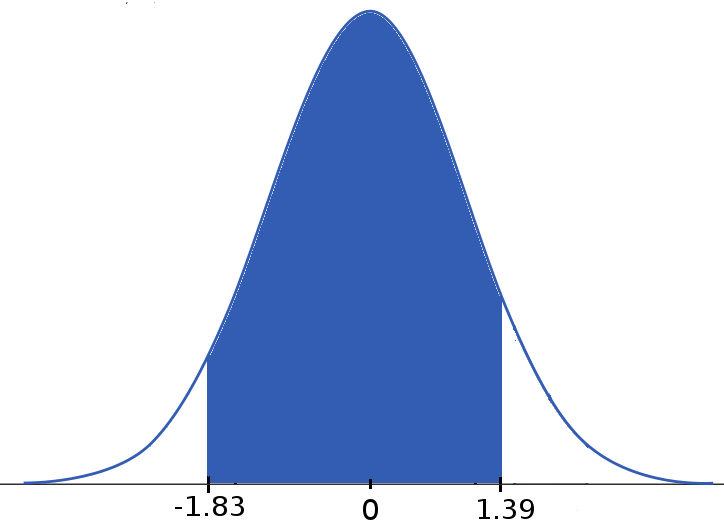 |
| Original: $N(6.84,1.55)$ | Standard Normal $N(0,1)$ |
$P(4 \lt X \lt 9)=F(9)-F(4)=\mbox{Table}(1.39)-\mbox{Table}(-1.83)$
$=0.9177-0.0336=0.8841.$