Here's a nice fun thought experiment: Consider the data set
$3,\, 3,\, 4,\, 5,\, 1000000.$
What are the mean, median and mode of this data set?
Do you notice anything interesting?
Warning: Averages are the most abused statistics on earth!
Example
Suppose the firm "Shady Real-Estate" is advertising a property which is located on a street in a bad area of town.
Strangely, an eccentric billionaire has decided to build a house on this street. The following are the prices of the properties on this street:
$10000,$ $20000,$ $35000,$ $42000,$ $60000,$ $10000000.$
What do you think? To entice buyers, Shady Real Estate will report:
(a) the mean property value on this street, or
(b) the median property value on this street
Savvy Citizen Fact:
The mean is sensitive to extreme observations in data.
The median and the mode on the other hand, are not as sensitive to extreme observations.
This is why we say that the median and the mode are resistant measures of center.
The mean is NOT a resistant measure of center.
Recall: Consider the data set of the travel times in minutes for $15$ workers in North Carolina, chosen at random by the Census Bureau which is summarized by the stem plot below. $$ \begin{array}{|r|l|} \hline 0 & 5\\ \hline 1 & 000025\\ \hline 2 & 005\\ \hline 3 & 00\\ \hline 4 & 00\\ \hline 5 & \\ \hline 6 & 0\\ \hline \end{array} $$ We saw that the mode is $10,$ the median is $20,$ and the mean $22.47.$
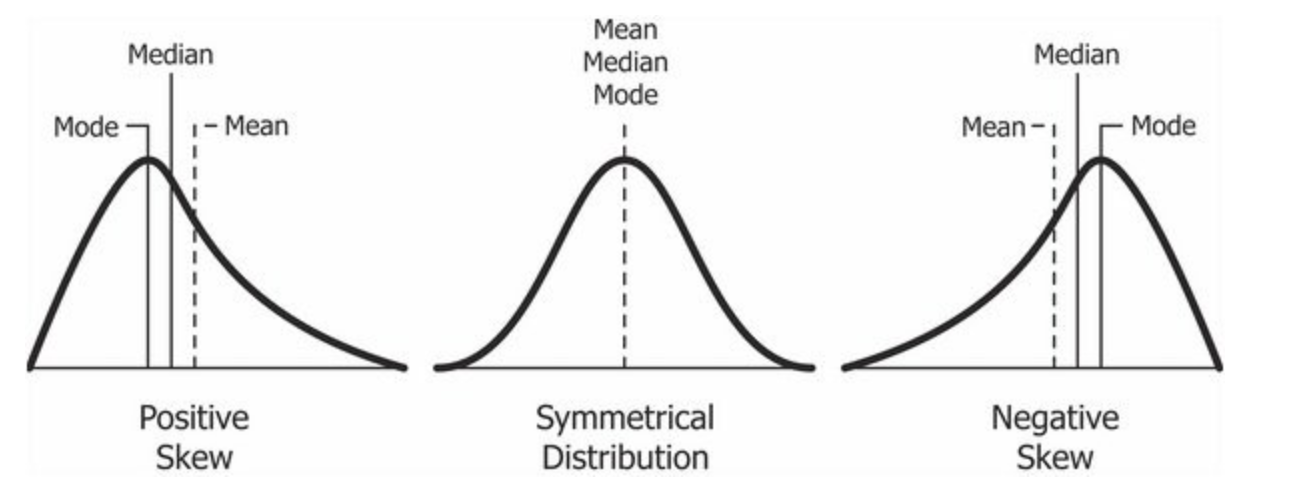
Comparing Means, Medians, and Modes
The mean, median, and mode of a roughly symmetric distribution are close together.
The mean, median, and mode of a perfectly symmetric distribution are equal.
In a skewed distribution, the mean is usually drawn farther out in the long tail than the median.
The mode is located at the peak(s) of a distribution.
Comparing Means, Medians, and Modes