The Median.
For any data set, there is a value for which $50\%$ of data points lie below, and $50\%$ lie above. This value is called the median.
Like an average, the median is another measure of center of a distribution.
Fact: The median is literally the middle value of a data set when we line them all up in order.
Example: Find the median of the data set: $3, 3, 4, 5, 7.$
Example: Find the median of the data set: $3, 4, 5, 7.$
Quartiles
For any data set, there is a value for which $25\%$ of the data points lie below, and is called the 1st quartile, and is denoted $Q_1$.
For any data set, there is a value for which $75\%$ of the data points lie below, and is called the 3rd quartile, and is denoted $Q_3$.
Question: What about the 2nd quartile?!
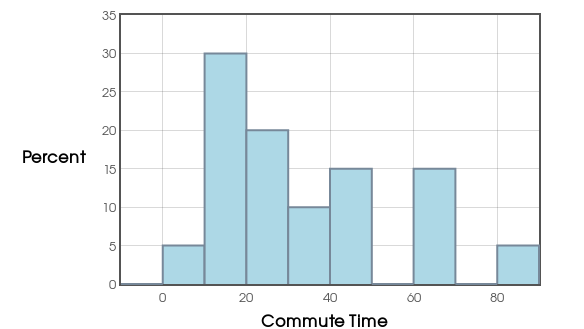
Example. Below are the commute times in minutes of $20$ randomly chosen New York workers in ascending order.
$5,\, 10,\, 10,\, 15,\, 15\, | \,15,\, 15,\, 20,\, 20,\, 20\, | \, 25, \, 30,\, 30,\, 40,\, 40\, |\, 45,\, 60,\, 60,\, 65,\, 85$
Find the median and the $1$st and $3$rd quartiles.
The Interquartile Range: The spread of the data between the 1st and 3rd quartiles is called the inner quartile range which we will denote as $IQR$.
Example: The $IQR$ for our New York commute-time data.
$5,\, 10,\, 10,\, 15,\, 15\, |\, 15,\, 15,\, 20,\, 20,\, 20\, |\, 25,\, 30,\, 30,\, 40,\, 40\, |\, 45,\, 60,\, 60,\, 65,\, 85$
Question: What is an outlier?
Below is a histogram of our commute-time data. Do you see any potential outliers?
Question: Is there an objective way to identify outliers?
Answer: Yes! The $1.5 \cdot IQR$ rule!
Any data point which strays beyond $1.5$ times the $IQR$ is flagged as an outlier.
More Precisely...
A value which falls below $Q_1-1.5 \cdot IQR$ is flagged as a low outlier.
A value which falls above $Q_3+1.5 \cdot IQR$ is flagged as a high outlier.
Example: Does our New York commute-time data contain any outliers according to the $1.5 \cdot IQR$ rule?
$5,\, 10,\, 10,\, 15,\, 15\, | \,15,\, 15,\, 20,\, 20,\, 20\, | \, 25, \, 30,\, 30,\, 40,\, 40\, |\, 45,\, 60,\, 60,\, 65,\, 85$
Percentiles
A value for which $p\%$ of the data falls below it is called the $p$th percentile.
Example: A value for which $10\%$ of all the values in a data set lie below it is called the $10$th percentile.
Example: A value for which $85\%$ of all the values in a data set lie below it is called the $85$th percentile.
Remark: As the quartiles divide the data up into quarters, percentiles divide the data up into hundredths.
Example: Consider our table of frequencies for the number of hours SWOCC students claimed to work each day. $$2,\, 2,\, 3,\, 3,\, 3,\, 4,\, 4,\, 4,\, 5,\, 5,\, 5,\, 5,\, 5,\, 6,\, 7$$ What is the $40$th percentile?
A Formula for Finding Unknown Position from a Known Percentile
To find the the position of the data point that is the $k$th percentile in a data set, use the formula $$i=\frac{k}{100}(n+1)$$ Then round the position $i$ both down and up to the nearest integers.
The average of the values at these positions is your $k$th percentile.
Example: Again, using our SWOCC student worker data, $$2,\, 2,\, 3,\, 3,\, 3,\, 4,\, 4,\, 4,\, 5,\, 5,\, 5,\, 5,\, 5,\, 6,\, 7$$ to find the $40$th percentile of these $15$ ordered data points, we compute $$i=\frac{40}{100}(15+1)=0.4 \cdot 16=6.4.$$ Thus, the $40$th percentile is the average of the values at the $6$th and $7$th positions. That is, $4$ hours is the $40$th percentile.
On the other hand, suppose we want to know, what percentile the value "$5$" occupies in our data set: $$ 2,\, 2,\, 3,\, 3,\, 3,\, 4,\, 4,\, 4,\, 5,\, 5,\, 5,\, 5,\, 5,\, 6,\, 7 $$ What do we do?
ANOTHER FORMULA!!!!!!!!!

Another Formula: Find Unknown Percentile from Known Position To find the percentile from position:
1) Order the data from smallest to largest.
2) Let $x$ = the number of data values counting from the bottom of the data list up to but not including the data value for which you want to find the percentile.
3) Let $y$ = the number of data values equal to the data value for which you want to find the percentile.
4) Let $n$ = the total number of data points.
5) Then the percentile value of the data point is found by computing $$p=\left( \frac{x+0.5y}{n} \right)\cdot 100$$ and rounding to the nearest integer.
Thus, for our data set $$ 2,\, 2,\, 3,\, 3,\, 3,\, 4,\, 4,\, 4,\, 5,\, 5,\, 5,\, 5,\, 5,\, 6,\, 7 $$ the value "$5$" corresponds to $x=8$, $y=5$, and $n=15$ in the above formula.
There's Always Room for One More Example...
Billy Bob was ranked $73$rd in his graduating class of $245$ students. Find the percentile of Billy Bob’s ranking
Assume there are no ties in ranking.
A Small Note on Interpretation
Being in a high or low percentile can be either "good" or "bad."
It all depends on context.
Example: Suppose you take a stats exam. Higher scores are better. You score in the $90$th percentile. Is this a good result?
Example: Suppose you're running a race. Faster (smaller time) is better. You score in the $90$th percentile. Is this a good result?