Histograms: Histograms are a way to visually display the distribution of values in quantitative data.
In other words, histograms are the picture version a frequency tables.
Pop Quiz: What are the two possible kinds of quantitative data?
Fact: A histogram may summarize either discrete or continuous data.
Example: Discrete Data.
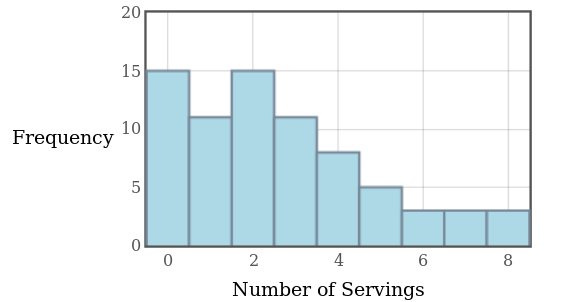
The figure below is a histogram of the self-reported number of daily servings of fruit eaten for a sample of $74$ students.
Note: A histogram is merely a graphical representation of a frequency table.
$
\begin{array}{|r|l|}
\hline
\mbox{Number of Servings} & \mbox{Frequency} \\ \hline
0 & 15\\ \hline
1 & 11\\ \hline
2 & 15\\ \hline
3 & 11\\ \hline
4 & 8\\ \hline
5 & 5\\ \hline
6 & 3\\ \hline
7 & 3\\ \hline
8 & 3\\ \hline
\end{array}
$
Question: About how many of these students ate $2$ servings of fruit per day?
Question: About what percentage of these students ate between $3$ and $5$ servings of fruit per day, inclusive?
Example: Continuous Data.
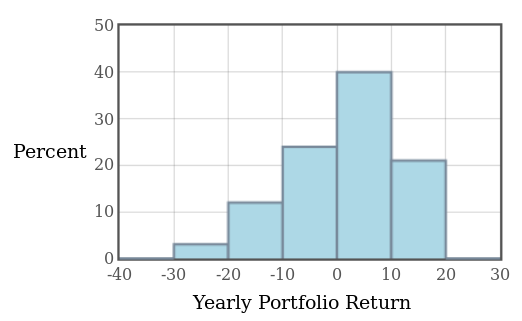
Below is a histogram of the percent return on a randomly chosen collection of client portfolios for the S.P. Martini Wealth Management Company.
Note: A histogram is merely a graphical representation of a frequency table.
$
\begin{array}{|r|l|}
\hline
\mbox{Yearly Portfolio Return} & \mbox{Percentage} \\ \hline
\mbox{-30% to -20%} & 3\% \\ \hline
\mbox{-20% to -10%} & 12\% \\ \hline
\mbox{-10% to -0%} & 24\% \\ \hline
\mbox{0% to 10%} & 40\% \\ \hline
\mbox{10% to 20%} & 21\% \\ \hline
\end{array}
$
Question: About what percentage of portfolios saw a return between $-20\%$ and $-10\%?$
Question: About what percentage of portfolios actually made money (saw a return of more than $0\%$)?
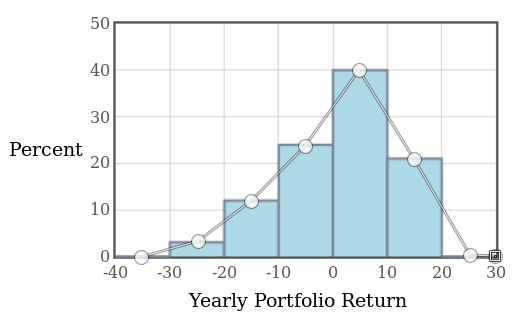
Frequency Polygons: Frequency polygons are the line-graph version of a histogram.
They are also useful for understanding the shape of a distribution.
To make a frequency polygon, take the midpoint of each bar (or bin) as the horizontal, and plot it against the frequency (or relative frequency, or percentage) as the vertical.
Example: Below, the frequency polygon is overlaid on top of the histogram for the S.P. Martini Wealth Management Data.
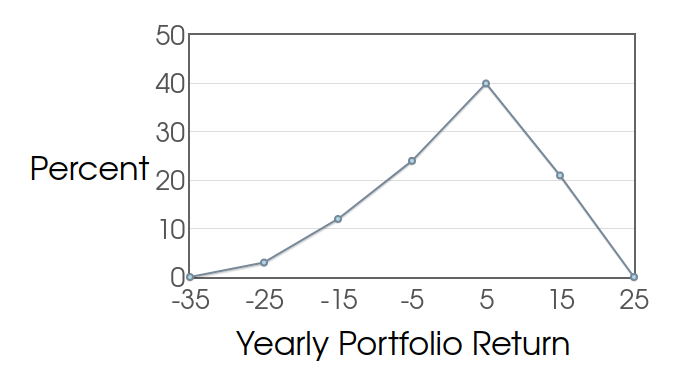
Example: Below is just the frequency polygon for the S.P. Martini Wealth Management Data.
| Percent | |
| Yearly Portfolio Return |
Note: The frequency polygon is merely a line graph of a frequency table where the left hand column is now the midpoint of each bin (instead of an interval).
 $
\begin{array}{|r|l|}
\hline
\mbox{Yearly Portfolio Return} & \mbox{Percentage} \\ \hline
\mbox{-25%} & 3\% \\ \hline
\mbox{-15%} & 12\% \\ \hline
\mbox{-5%} & 24\% \\ \hline
\mbox{5%} & 40\% \\ \hline
\mbox{15%} & 21\% \\ \hline
\end{array}
$
$
\begin{array}{|r|l|}
\hline
\mbox{Yearly Portfolio Return} & \mbox{Percentage} \\ \hline
\mbox{-25%} & 3\% \\ \hline
\mbox{-15%} & 12\% \\ \hline
\mbox{-5%} & 24\% \\ \hline
\mbox{5%} & 40\% \\ \hline
\mbox{15%} & 21\% \\ \hline
\end{array}
$
Making a Histogram: Listed below are a random sample of commute times to work of $20$ for workers in Martiniville, U.S.A. in order from smallest to largest.
$5, 8, 11, 13, 15, 16, 17, 17, 19, 19, 30, 31, 33, 35, 43, 44, 60, 61, 62, 82$
Construct a histogram either by hand,
by using your TI Calculator,
or by using Holt.Blue.