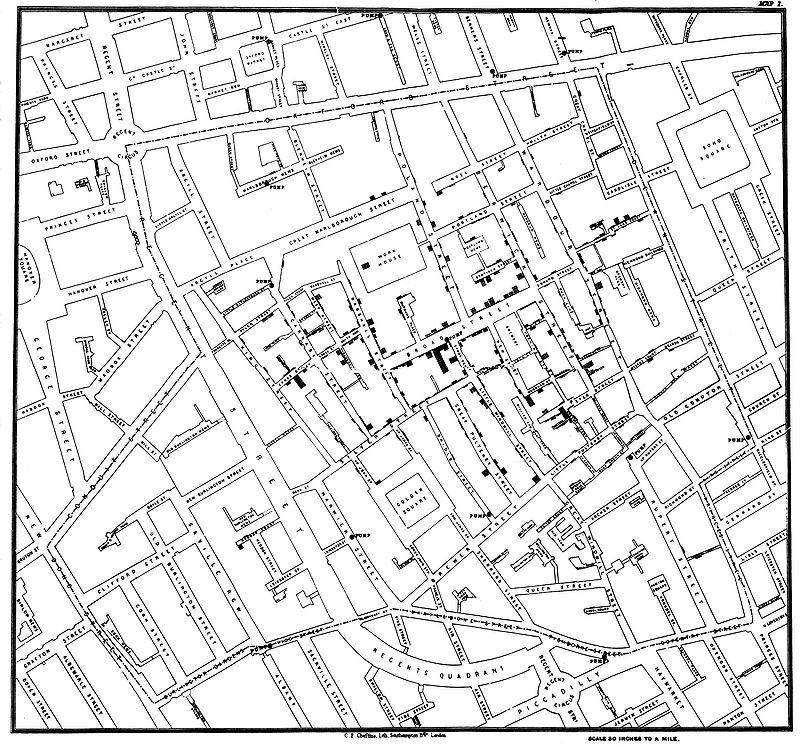
Let me tell you the story of a graph which changed the world.
Some people hate the very name of statistics, but I find them full of beauty and interest. Whenever they are not brutalised, but delicately handled by the higher methods, and are warily interpreted, their power of dealing with complicated phenomena is extraordinary.
-Sir Francis Galton
When we collect data, we are looking at a group of individuals.
The various attributes of these individuals are the variables.
The values we record of these variables is the data
Example: Who were the individuals in the case of the "John Snow" graph?
What variable John Snow was interested in?
Some variables numerically measure some characteristic of an individual, such as height, weight, exam scores, and so on. These are called quantitative variables.
Other variables simply put individuals into categories, such as sex, school subject, color, and so on. These are called categorical variables.
Super Important Vocab:
The population is entire group of individuals (people, cars, animals, ball bearings, etc.) which we want information about.
A small part of the population we choose to gain information about the whole is called a sample.
Gaining information about the entire population from a sample is called inference.
Question: Why do we take samples instead of looking at the whole population?
Some More Big-Time, Super-Important Vocab:
A parameter is a numerical fact about a population.
A statistic is a value we compute from a sample of our population.
We very often use statistics to estimate parameters.
Brownie Point Opportunity: This is an example of...
Example: Determine what the key terms refer to in the following study. We want to know the average (mean) amount of money spent on school uniforms each year by families with children at Knoll Academy. We randomly survey $3$ families with children in the school. These families spent $\$65,$ $\$75,$ and $\$95.$
| The Population: | The Sample: |
| Families with children at Knoll Academy. | The three randomly chosen families. |
| The Parameter: | The Statistic: |
| The average (mean) amount of money spent on school uniforms each year. | $\bar{x}=\displaystyle \frac{\$65+\$75+\$95}{3}=\$78.34$ |
| The Variable: | The Data: |
| Amount of money spent on school uniforms. | $\$65,$ $\$75,$ $\$95$ |
An Analogy

The variable is the name of the column the data is entered into, but the data is the collection of values entered into the cells.
Generally Speaking, in Plain Language...
| The Population: | The Sample: |
| The collection of individuals we want to study. | The collection of individuals we actually observed. |
| The Parameter: | The Statistic: |
| Some numerical fact about our population. . For example, an average or percentage. | An estimate of the parameter computed from our sample. |
| The Variable: | The Data: |
| The thing that changes from individual to individual. (The name we would give to the excel column.) | The list of numbers in our data set. . (The numbers that go into the excel column.) |