Example: An Oregon university wants to understand how a student's background could influence whether they succeed in completing their educational goals.
To answer some of these questions, the university tracked a group of students in an engineering program.
One potential factor they considered is if the student comes from 1) a place in or near an urban center or 2) a rural area.
Of the $65$ students who were from a place in or near an urban center, $52$ completed their program.
Of the $55$ students who were from a rural area, $30$ completed their program.
Treating this group a random sample, does the institution have evidence that a where a student comes from affects completion rates in this program?
Comparing Two Proportions
The proportion for the "urban" students is $$\hat{p}_1=\frac{52}{65}=0.8$$ and the proportion for "rural" students is $$\hat{p}_2=\frac{30}{55}=0.5455$$ Is this good evidence of unequal completion rates?
The Two-Sample $z$ Procedures
Draw two independent SRSs from two populations.
The Two-Sample $z$ statistic is $$z=\frac{\hat{p}_1-\hat{p}_2}{\displaystyle \sqrt{\hat{p}(1-\hat{p})\left(\frac{1}{n_1}+\frac{1}{n_2}\right)}}$$ where $$\hat{p}=\frac{\mbox{combined successes of both groups}}{\displaystyle n_1+n_2}$$ is the combined (or pooled) proportion for both groups.
The Two-Sample $z$ statistic follows what kind of distribution?
The Two-Sample $z$ Test
To test the hypothesis $H_0: p_1=p_2$, compute the Two-Sample $t$ test statistic $$z=\frac{\hat{p}_1-\hat{p}_2}{\displaystyle \sqrt{\hat{p}(1-\hat{p})\left(\frac{1}{n_1}+\frac{1}{n_2}\right)}}$$ where $$\hat{p}=\frac{\mbox{combined successes of both groups}}{\displaystyle n_1+n_2}$$ is the combined (or pooled) proportion for both groups.
The $p$-value of this test statistic is the degree of evidence against the null hypothesis.
Test of Significance Comparing an Two Unknown Proportions
Step 0: Choose your level of significance, $\alpha,$ and check to make sure the techniques you want to use are appropriate. You may do this by plotting your data.
Step 1: State your hypotheses: $H_0: p_1=p_2$ and $H_a:\begin{array}{c} p_1 \neq p_2 \\ p_1 \gt p_2 \\ p_1 \lt p_2 \end{array}.$
Step 2: Compute the two-sample $z$ test statistic $\displaystyle z=\frac{\hat{p}_1-\hat{p}_2}{\displaystyle \sqrt{\hat{p}(1-\hat{p})\left(\frac{1}{n_1}+\frac{1}{n_2}\right)}}$ where $\hat{p}=\frac{\mbox{combined successes of both groups}}{\displaystyle n_1+n_2}.$
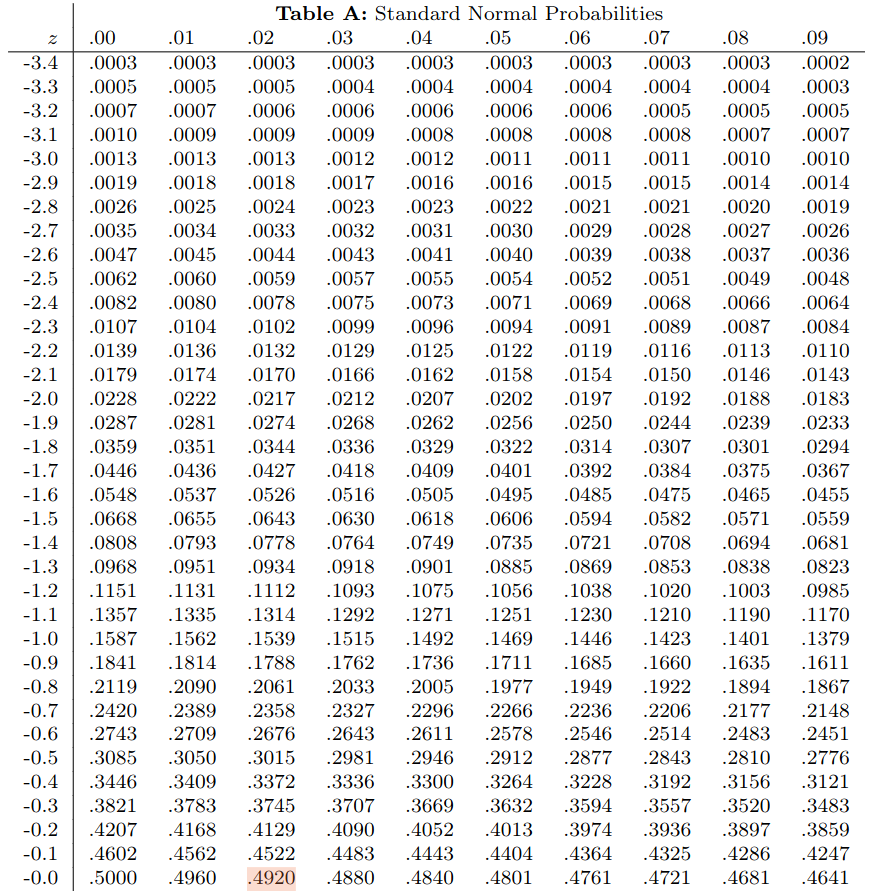
Step 3: Determine your $p\mbox{-value}$ by using software or Table A.
Step 4: State your conclusion (keep or reject $H_0$). If your $p\mbox{-value}$ falls below the significance level $\alpha,$ then we reject $H_0.$ Otherwise, we keep $H_0$. Also, summarize the conclusion using the language of the problem situation.
Guidelines for Use
Use the two-sample $z$ procedures when both samples have at least $5$ successes and $5$ failures.
That is, $$ n_1\hat{p_1}\geq 5,\,\,\,\, n_2\hat{p_2}\geq 5,\,\,\,\, n_1(1-\hat{p_1})\geq 5, \mbox{ and }\,\,\,\, n_2(1-\hat{p_2})\geq 5 $$ If these guidelines aren't met, the conclusions of the test are not reliable.
Student Completion Rates Revisited
An Oregon university wants to understand how a student's background could influence whether they succeed in completing their educational goals.
To answer some of these questions, the university tracked a group of students in an engineering program.
One potential factor they considered is if the student comes from 1) a place in or near an urban center or 2) a rural area.
Of the $65$ students who were from a place in or near an urban center, $52$ completed their program.
Of the $55$ students who were from a rural area, $30$ completed their program.
Treating this group a random sample, does the institution have evidence that a where a student comes from affects completion rates in this program?
Step 0: Preliminaries
We take $\alpha=0.01$ as our level of significance.
Also, $$n_1\hat{p_1}=52\geq 5,\,\,\,\, n_2\hat{p_2}=30\geq 5,\,\,\,\, n_1(1-\hat{p_1})=13\geq 5, \mbox{ and }\,\,\,\, n_2(1-\hat{p_2})=25\geq 5$$
So, the guidelines for use of the test are met.
Step 1: State Hypotheses
$$ \begin{array}{c} H_0: p_1=p_2\\ H_a: p_1 \neq p_2 \end{array} $$
Step 2: Compute Test Statistic
The proportion for "urban" students is $\hat{p}_1=\frac{52}{65}=0.8.$
The proportion for "rural" students is $\hat{p}_2=\frac{30}{55}=0.5455.$
The combined proportion is $\hat{p}=\frac{52+30}{65+55}=0.6833.$
The $z$-statistic is $$z=\frac{0.8-0.5455}{\displaystyle \sqrt{0.6833(1-0.6833)\left(\frac{1}{65}+\frac{1}{55}\right)}}=2.99$$
Step 3: Compute $p$-value
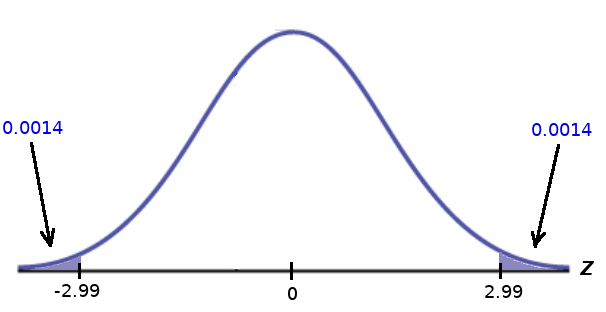
For $z=2.99,$ $$p\mbox{-value}=P(|z|\gt 2.99)=P(z\lt-2.99)+P(z \gt 2.99)=\color{blue}{0.0014}+\color{blue}{0.0014}=0.0028$$


Step 4: State Your Conclusion
Since $p$-value$=0.0028\lt 0.01=\alpha,$ there is strong evidence against the null hypothesis.
We conclude that the two population proportions are NOT the same.
That is, the completion rates of the "urban" and "rural" students are different. In particular, "urban" students have higher completion rates than "rural" students.
Student Completion Re-Revisited
An Oregon university wants to understand how a student's background could influence whether they succeed in completing their educational goals.
To answer some of these questions, the university tracked a group of students in an engineering program.
One potential factor they considered is whether the student identifies as female or male.
Of the $34$ students who identified as female, $23$ completed their program.
Of the $89$ students who identified as male, $60$ completed their program.
Treating this class a random sample, does the institution have evidence that the program completion rate differs between females and males?
Use significance level $\alpha=0.01.$
Step 0: Preliminaries
We take $\alpha=0.01$ as our level of significance.
Also, $$n_F\hat{p_F}=23\geq 5,\,\,\,\, n_M\hat{p_M}=60\geq 5,\,\,\,\, n_F(1-\hat{p_F})=11\geq 5, \mbox{ and }\,\,\,\, n_M(1-\hat{p_M})=29\geq 5$$
So, the guidelines for use of the test are met.
Step 1: State Hypotheses
$$ \begin{array}{c} H_0: p_F=p_M\\ H_a: p_F \neq p_M \end{array} $$
Step 2: Compute Test Statistic
The proportion for females is $\hat{p}_F=\frac{23}{34}=0.6765.$
The proportion for males is $\hat{p}_M=\frac{60}{89}=0.6742.$
The combined proportion is $\hat{p}=\frac{23+60}{34+89}=0.6748.$
The $z$-statistic is $$z=\frac{0.6765-0.6742}{\displaystyle \sqrt{0.6748(1-0.6748)\left(\frac{1}{34}+\frac{1}{89}\right)}}=0.02$$
Step 3: Compute $p$-value
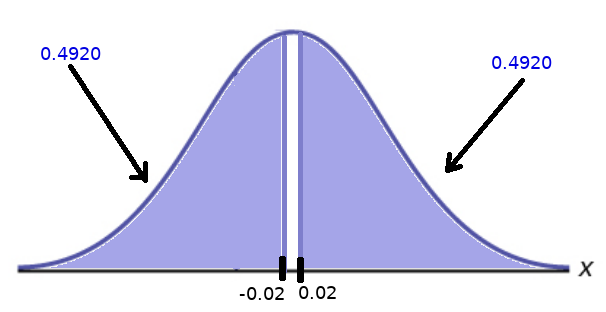
For $z=0.02,$ $$p\mbox{-value}=P(|z|\gt 0.02)=P(z\lt -0.02)+P(z \gt 0.02)=\color{blue}{0.4920}+\color{blue}{0.4920}=0.984$$


Step 4: State Your Conclusion
Since $p$-value$=0.984\gt 0.01=\alpha,$ there is absolutely no evidence against the null hypothesis.
We conclude that the two population proportions are the same.
That is, there is no difference between the completion rates of female and male students.