The Big Idea
The expected value (or mean) of a random variable $X$ is the long-term average of observed values of $X.$
Example: Roll a fair die. What is the long-term average?
$\{$
 $,$
$,$
 $,$
$,$
 $,$
$,$
 $,$
$,$
 $,$
$,$
 $\}$
$\}$
$,$
$,$
$,$
$,$
$,$
$\}$
Long-Term Average of Rolling a Fair Die
| Empirical Average | |||
| Number of Rolls |
Calculating the Expected Value $\mu$ of a Random Variable $X$
$$\mu=X_1 \cdot P(X_1)+X_2 \cdot P(X_2)+\cdots+X_n \cdot P(X_n)$$
Example
For tossing a fair die, $P(X)=\frac{1}{6}$ for any $X\in \{1,2,3,4,5,6\}.$ $$ \begin{array}{l} \mu= 1 \cdot P(1)+2 \cdot P(2)+3 \cdot P(3)+ 4 \cdot P(4)+5 \cdot P(5)+1 6 \cdot P(6)\\ =1 \cdot \frac{1}{6}+2 \cdot \frac{1}{6}+3 \cdot \frac{1}{6}+4 \cdot \frac{1}{6}+ 5 \cdot \frac{1}{6}+ 6 \cdot \frac{1}{6}\\ =3.5 \end{array} $$
Example
For tossing a fair die, $P(X)=\frac{1}{6}$ for any $X\in \{1,2,3,4,5,6\}.$
This table of outcomes and probabilities is useful for calculating the mean $\mu.$ $$ \begin{array}{|l|l|} \hline X & P(X)\\ \hline 1 & \frac{1}{6}\\ \hline 2 & \frac{1}{6} \\ \hline 3 & \frac{1}{6} \\ \hline 4 & \frac{1}{6} \\ \hline 5 & \frac{1}{6} \\ \hline 6 & \frac{1}{6} \\ \hline \end{array} $$ $$\displaystyle \mu=1 \cdot \frac{1}{6}+2 \cdot \frac{1}{6}+3 \cdot \frac{1}{6}+4 \cdot \frac{1}{6}+ 5 \cdot \frac{1}{6}+ 6 \cdot \frac{1}{6}=3.5$$
Example
A crooked die has the following distribution. Find $\mu.$ $$ \begin{array}{|l|l|} \hline X & P(X)\\ \hline 1 & \frac{1}{12}\\ \hline 2 & \frac{1}{12} \\ \hline 3 & \frac{1}{12} \\ \hline 4 & \frac{1}{6} \\ \hline 5 & \frac{1}{4} \\ \hline 6 & \frac{1}{3} \\ \hline \end{array} $$
Solution
A crooked die has the following distribution. Find $\mu.$ $$ \begin{array}{|l|l|} \hline x & P(X=x)\\ \hline 1 & \frac{1}{12}\\ \hline 2 & \frac{1}{12} \\ \hline 3 & \frac{1}{12} \\ \hline 4 & \frac{1}{6} \\ \hline 5 & \frac{1}{4} \\ \hline 6 & \frac{1}{3} \\ \hline \end{array} $$ $$ \mu=1 \cdot \frac{1}{12}+2 \cdot \frac{1}{12}+3 \cdot \frac{1}{12}+4 \cdot \frac{1}{6}+ 5 \cdot \frac{1}{4}+ 6 \cdot \frac{1}{3}=\frac{53}{12}\approx 4.42 $$
Long-Term Average of Our Crooked Die
| Empirical Average | |||
| Number of Rolls |
Example: Roulette
A roulette wheel has $38$ numbers: $1$ through $36,$ $0,$ and $00.$ A ball is rolled and it falls into one of the $38$ slots giving a winning number. The payout for betting on even (that is, even numbers $2$ through $36$) is $\$1$ plus the dollar that was bet. Find the expected value of betting on even.
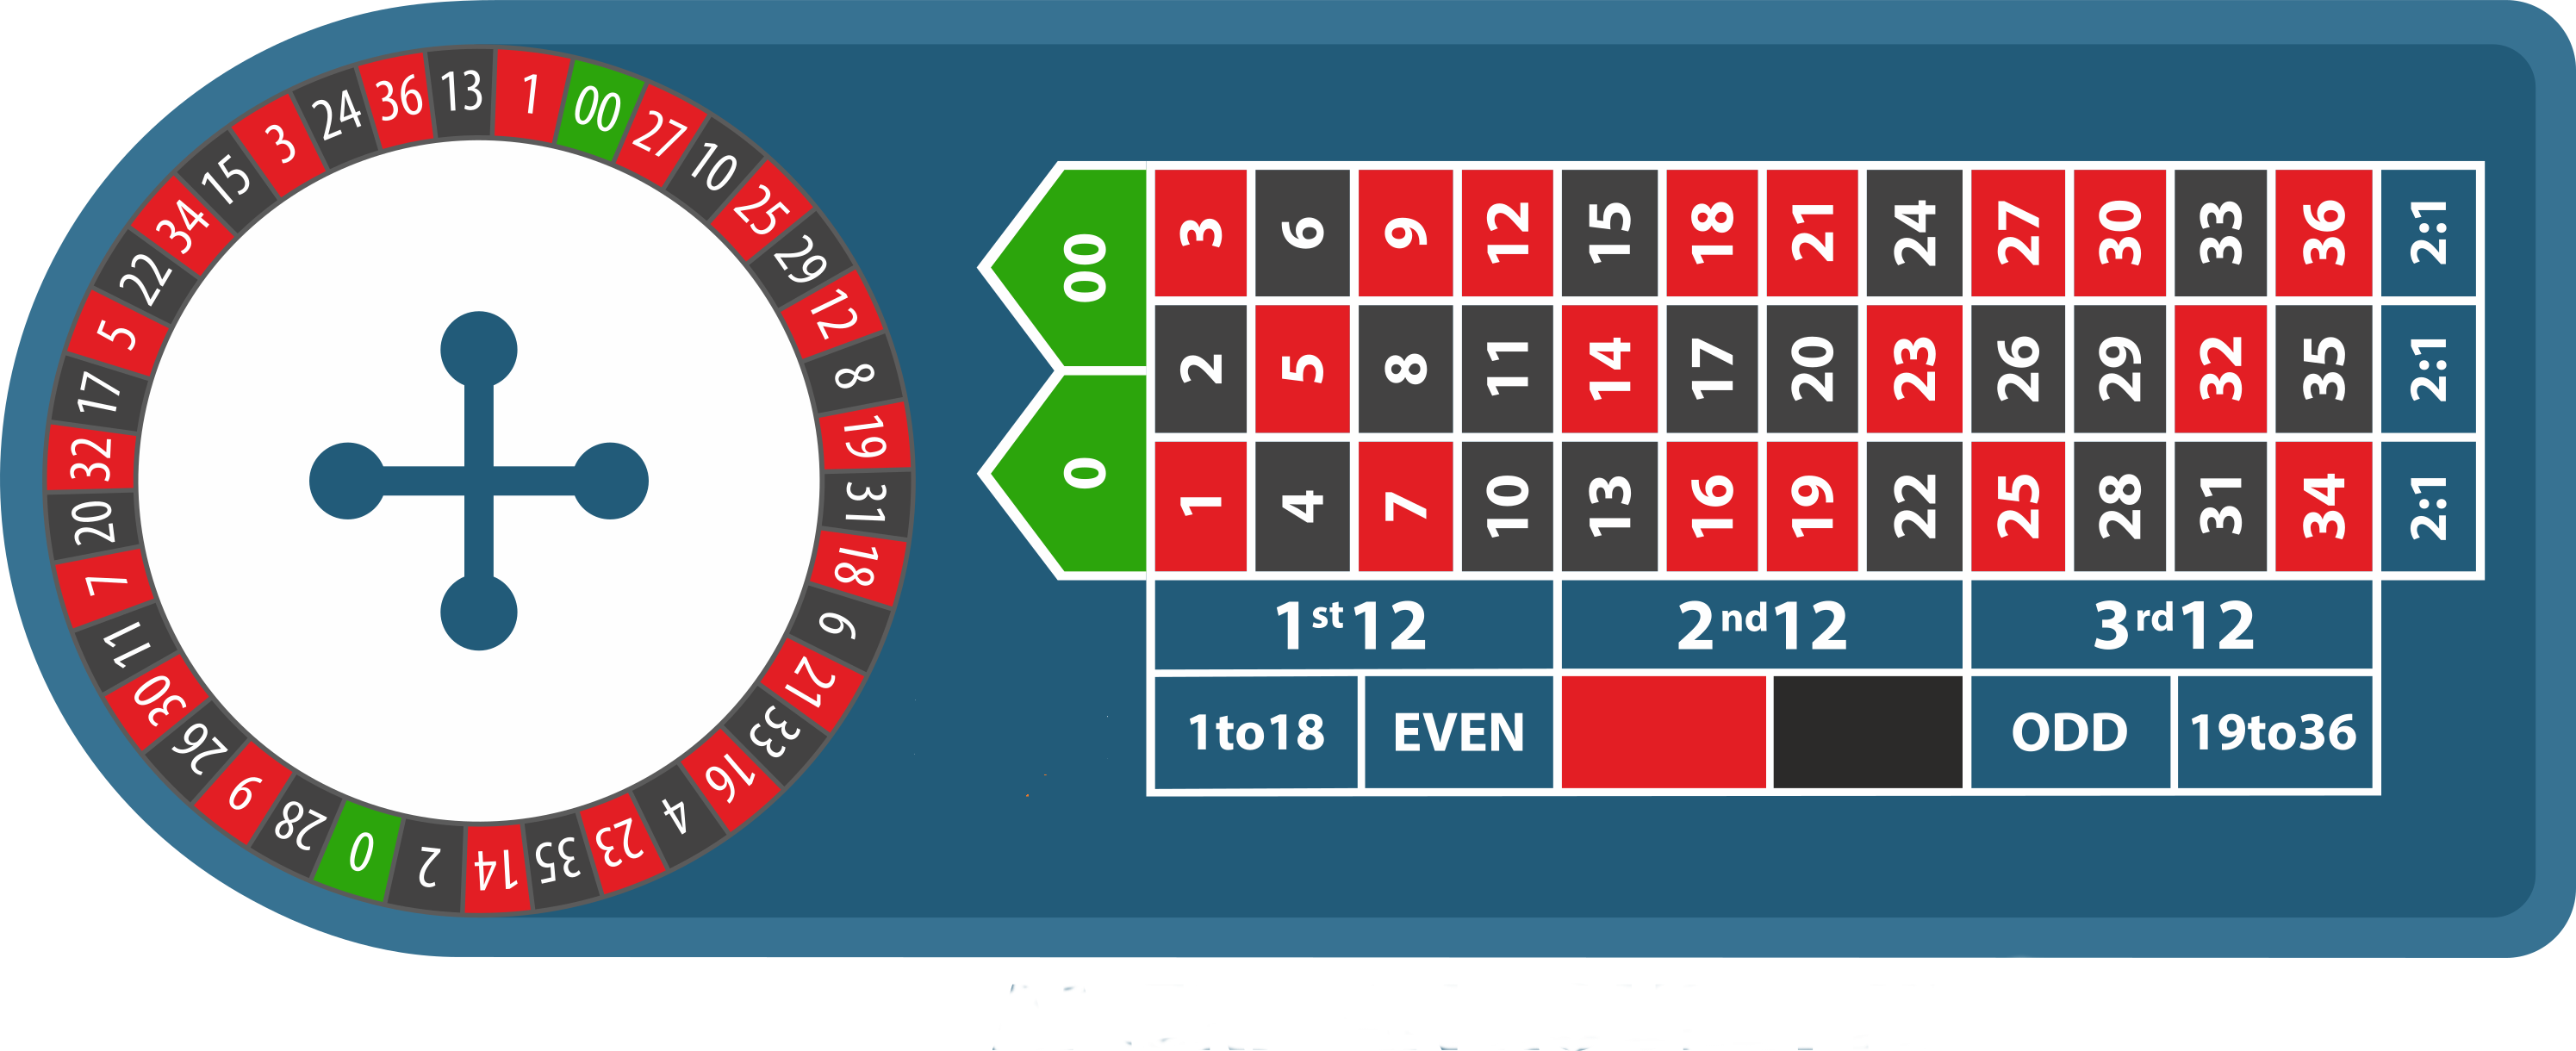
Solution
The PDF Table for Roulette $$ \begin{array}{|l|l|} \hline x & P(X=x)\\ \hline +1 & \frac{18}{38} \\ \hline -1 & \frac{20}{38} \\ \hline \end{array} $$ $$ \mu=1 \cdot \frac{18}{38}+(-1) \cdot \frac{20}{38} \approx -0.053 $$
Long-Term Average Winnings of Betting on Even in Roulette
| Empirical Average | ||||
| Number of Times Played |
Determining Long-Term Averages
Step 1: Create the PDF table of all outcomes and their respective probabilities. (As a check, all probabilities should sum to $1.$)
Step 2: Add up $\mbox{Outcome}\cdot\mbox{Probability}$ for every row in the table.
The challenge lies mainly in coming up with the PDF table.
Example
Sleazy P. Martini offers Billy Bob to play a game which involves selecting a card from a regular $52$-card deck and tossing a coin. The coin is a crooked coin with $P(\mbox{Heads})=0.45$ and $P(\mbox{Tails})=0.55.$
• If the card is a face card, and the coin lands on Heads, Billy Bob wins $\$7.$
• If the card is a face card, and the coin lands on Tails, Billy Bob wins $\$2.$
• If the card is not a face card, Billy Bob loses $\$3,$ no matter what the coin shows.
If Billy Bob were to play this game repeatedly, what is the long-term average of Billy Bob's winnings? Round your answer to the nearest cent.
Example
The PDF Table of Sleazy P's Game
$$ \begin{array}{|l|l|} \hline x & P(X=x)\\ \hline +7 & 0.45 \cdot \frac{3}{13}\\ \hline +2 & 0.55 \cdot \frac{3}{13} \\ \hline -3 & \frac{10}{13} \\ \hline \end{array} $$ $$\mu=7 \cdot 0.45 \cdot \frac{3}{13}+ 2 \cdot 0.55 \cdot \frac{3}{13}+(-3) \cdot \frac{10}{13}=-\frac{69}{52}\approx -1.33$$
Long-Term Average of Billy Bob's "Winnings"
| Empirical Average | |||
| Number of Times Played |
Fact: Life is uncertain.
The above ideas translate well to dealing with uncertain outcomes.
For example, insurance premiums are based upon the expected value of a return. The probability of paying out (disaster strikes) is quite low which means most the the time they're making money. the expected return is positive. It's essentially no different than making a sure bet. $$ \begin{array}{|l|l|} \hline X & P(X)\\ \hline \mbox{lose money} & \mbox{small probability}\\ \hline \mbox{make money} & \mbox{large probability} \\ \hline \end{array} $$ Insurance companies aren't the only ones who must plan in the face of uncertainty.
Very often businesses will use historical data to estimate probabilities of different scenarios in order to plan for an uncertain future.
Example
A ski resort's whose profit depends on a random phenomenon: the weather.
If it snows more than $70$ inches in a season, the resort makes a profit of $\$300000.$ This happens $40\%$ of the time.
If it snows between $40$ and $70$ inches in a season, the resort's profits are cut in half: $\$150000.$ This happens $45\%$ of the time.
If it snows less than $40$ inches in a season, the resort's costs overwhelm revenue and it loses $\$70000.$ This happens $15\%$ of the time.
What is the long-term average yearly profit for the resort?