Any line can be written as $Ax+By=C$ (even vertical lines).
Non-vertical lines can be written as $y=mx+b$.
The collection of $x$,$y$ pairs which make the above equations a true statement always form a line.
Example: Consider line $y=2x-2$.
Let's make a table of solutions to this equation.
$$ \begin{array}{c|c} x & y \\ \hline -2 & \\ \hline -1 & \\ \hline 0 & \\ \hline 1 & \\ \hline 2 & \\ \hline \end{array} $$
Intercepts: A place (point) on a graph where a line or curve "hits" an axis is called an intercept.
When a curve hits the $x$-axis, the point is called an $x$-intercept.
When a curve hits the $y$-axis, the point is called a $y$-intercept.
Every line has at least one intercept.
Almost every non-vertical line has two intercepts.
Almost every vertical line has one intercept on the $x$-axis.
Example: Recall the graph of $y=2x-2$. Find the $x$ and $y$-intercept.
$$ \begin{array}{c|c} x & y \\ \hline -2 & -6 \\ \hline -1 & -4\\ \hline 0 & -2 \\ \hline 1 & 0 \\ \hline 2 & 2\\ \hline \end{array} $$
Where Two Lines Intersect: A point where two curves meet is called an intersection point
Any two lines have either one intersection point, no intersection point, or infinitely many intersection points.
Example: Graph the lines $y=2x-2$ and $y=-x+1$ to determine their intersection point.
$$ \begin{array}{c|c|c} x & y_1 & y_2 \\ \hline -2 & -6 & \\ \hline -1 & -4 &\\ \hline 0 & -2 & \\ \hline 1 & 0 & \\ \hline 2 & 2 & \\ \hline \end{array} $$
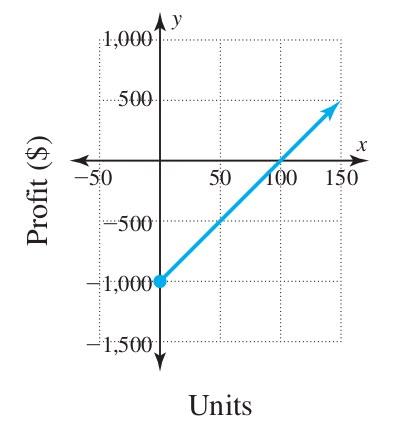
Interpreting Intercepts. In applications, intercepts usually have an interpretation.
Example: Consider the graph below of a business's profit versus the number of units it manufactures.
Interpreting Intersection Points. In applications, intersection points also have an interpretation.
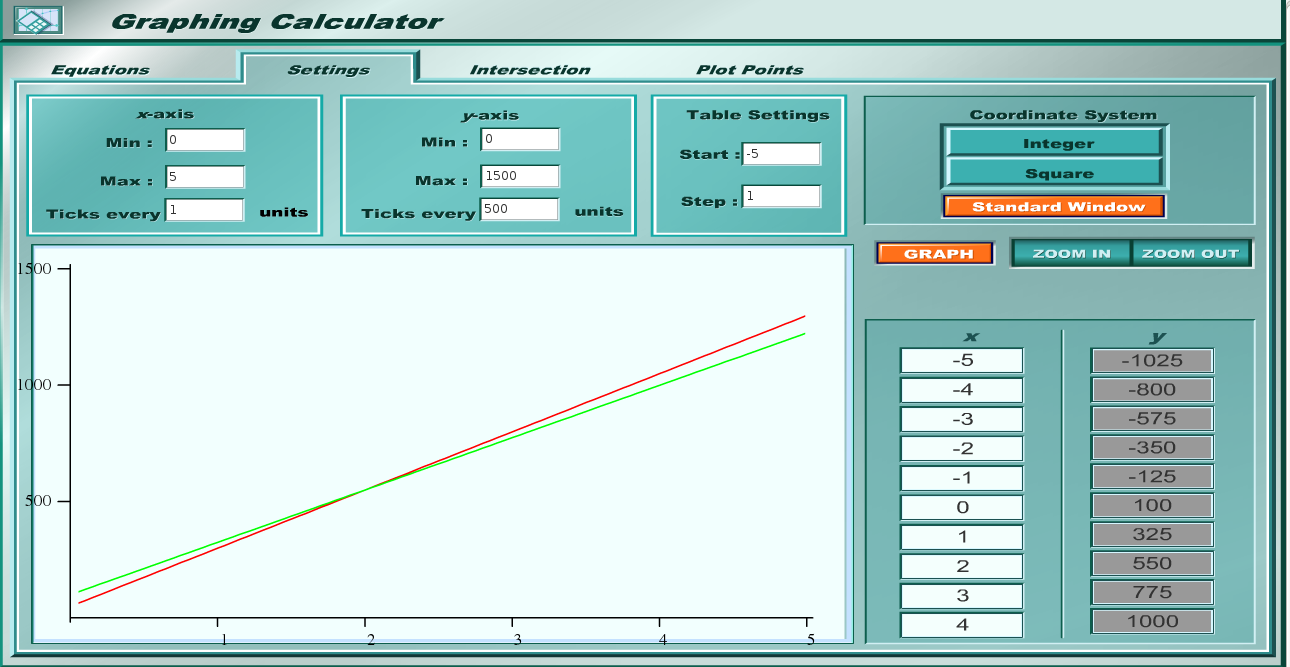
Example: is considering two options for a flat in downtown Sonora. The first flat is $\$$250 a month plus a $\$$50 non refundable deposit. The second flat costs $\$$225 a month plus a $\$$100 non refundable deposit. Letting the variable $x$ represent the number of months an apartment has been rented, $f(x)$ represent the rental cost by the end of the $x$th month, the system below models this situation. $$\left\{\begin{array}{ll}\mbox{Option A:} & f(x) = 250x + 50\\\mbox{Option B:} & f(x) = 225x + 100 \\\end{array}\right\}$$ Graph this system to find and interpret the intersection point. (Hint: You may want to use a graphing utility window of [0, 5, 1] by [0, 1500, 500].)